Explores
Creating Explore Charts
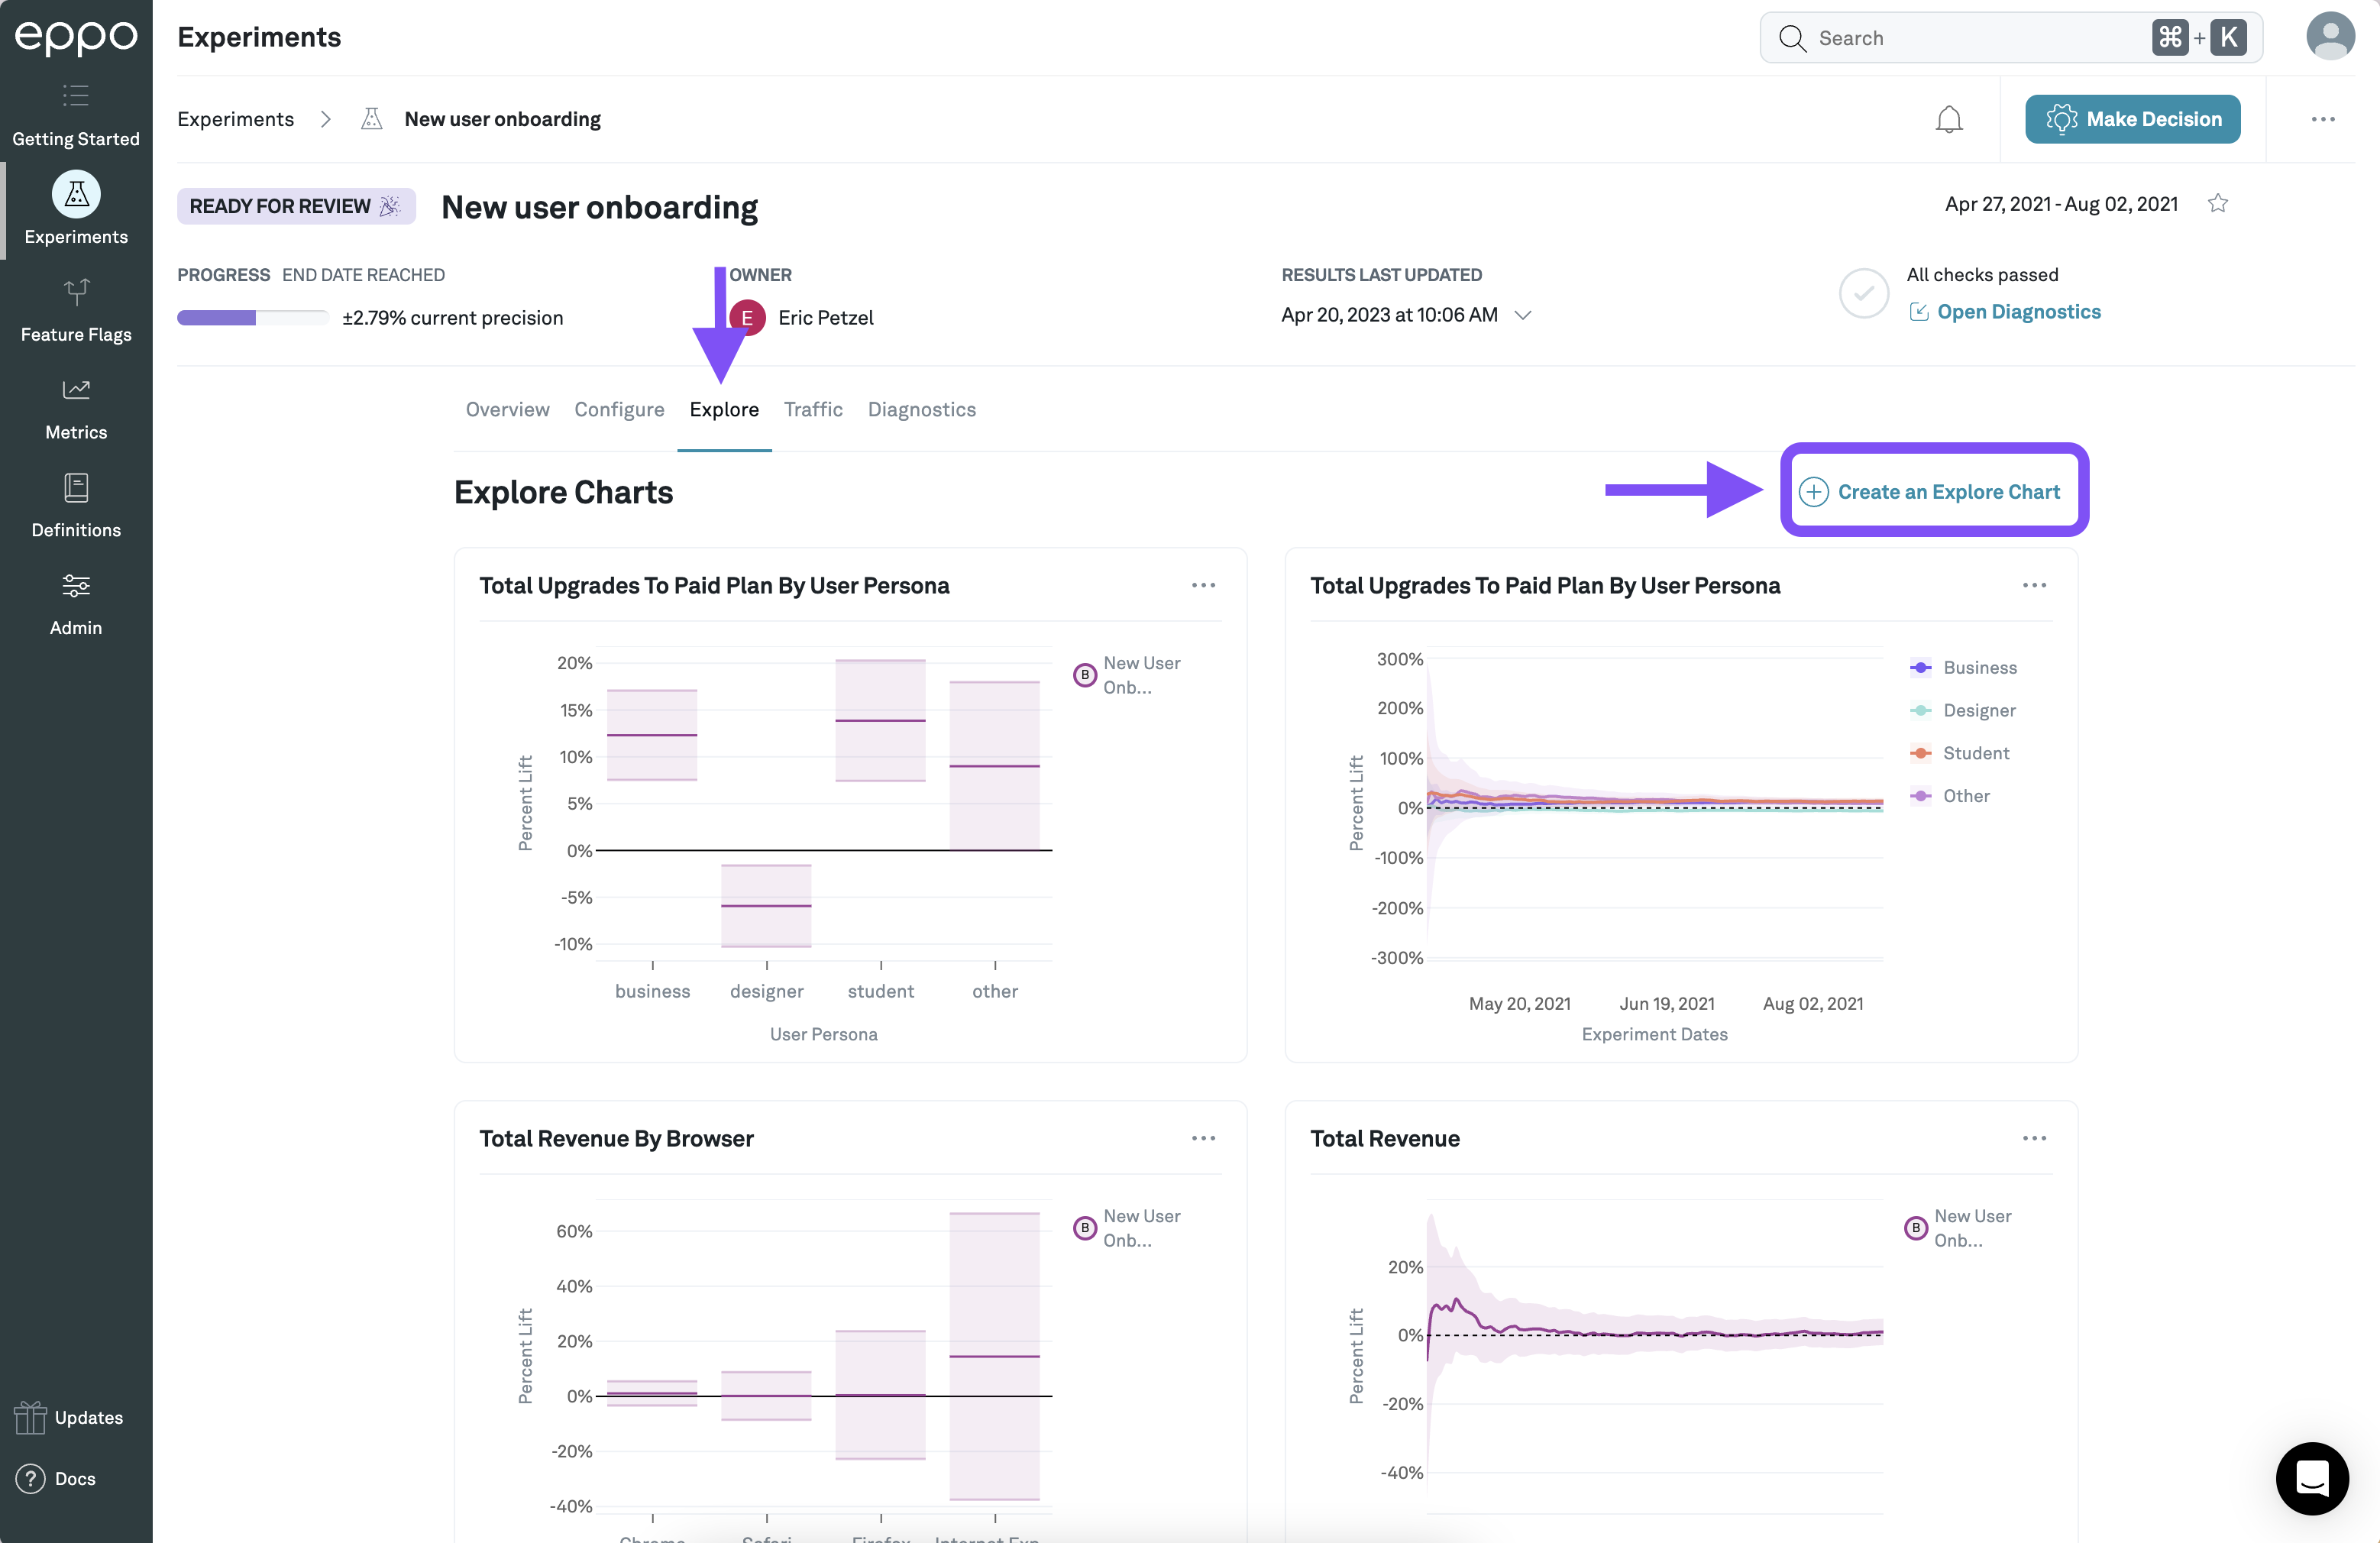
You can dive deeper into the results of your experiments by creating graphs with the result data. To do this, first navigate to the Analysis page using the tab on the left panel and click on the experiment you are interested in. Then, click on the Explore tab. You can create a new chart by clicking on the Create Explore button.
On the page to create a new Explore chart, you first need to select a metric. You can also add filters and a split-by to the chart and select the variation you are interested in. Click the Update Chart button to view the chart built with your selected criteria. Finally, you can click the Add to Experiment button to add it to the Explore tab of the experiment.
Chart Visualizations
After selecting a metric and updating the chart, you can select which visualization type on the right hand panel.
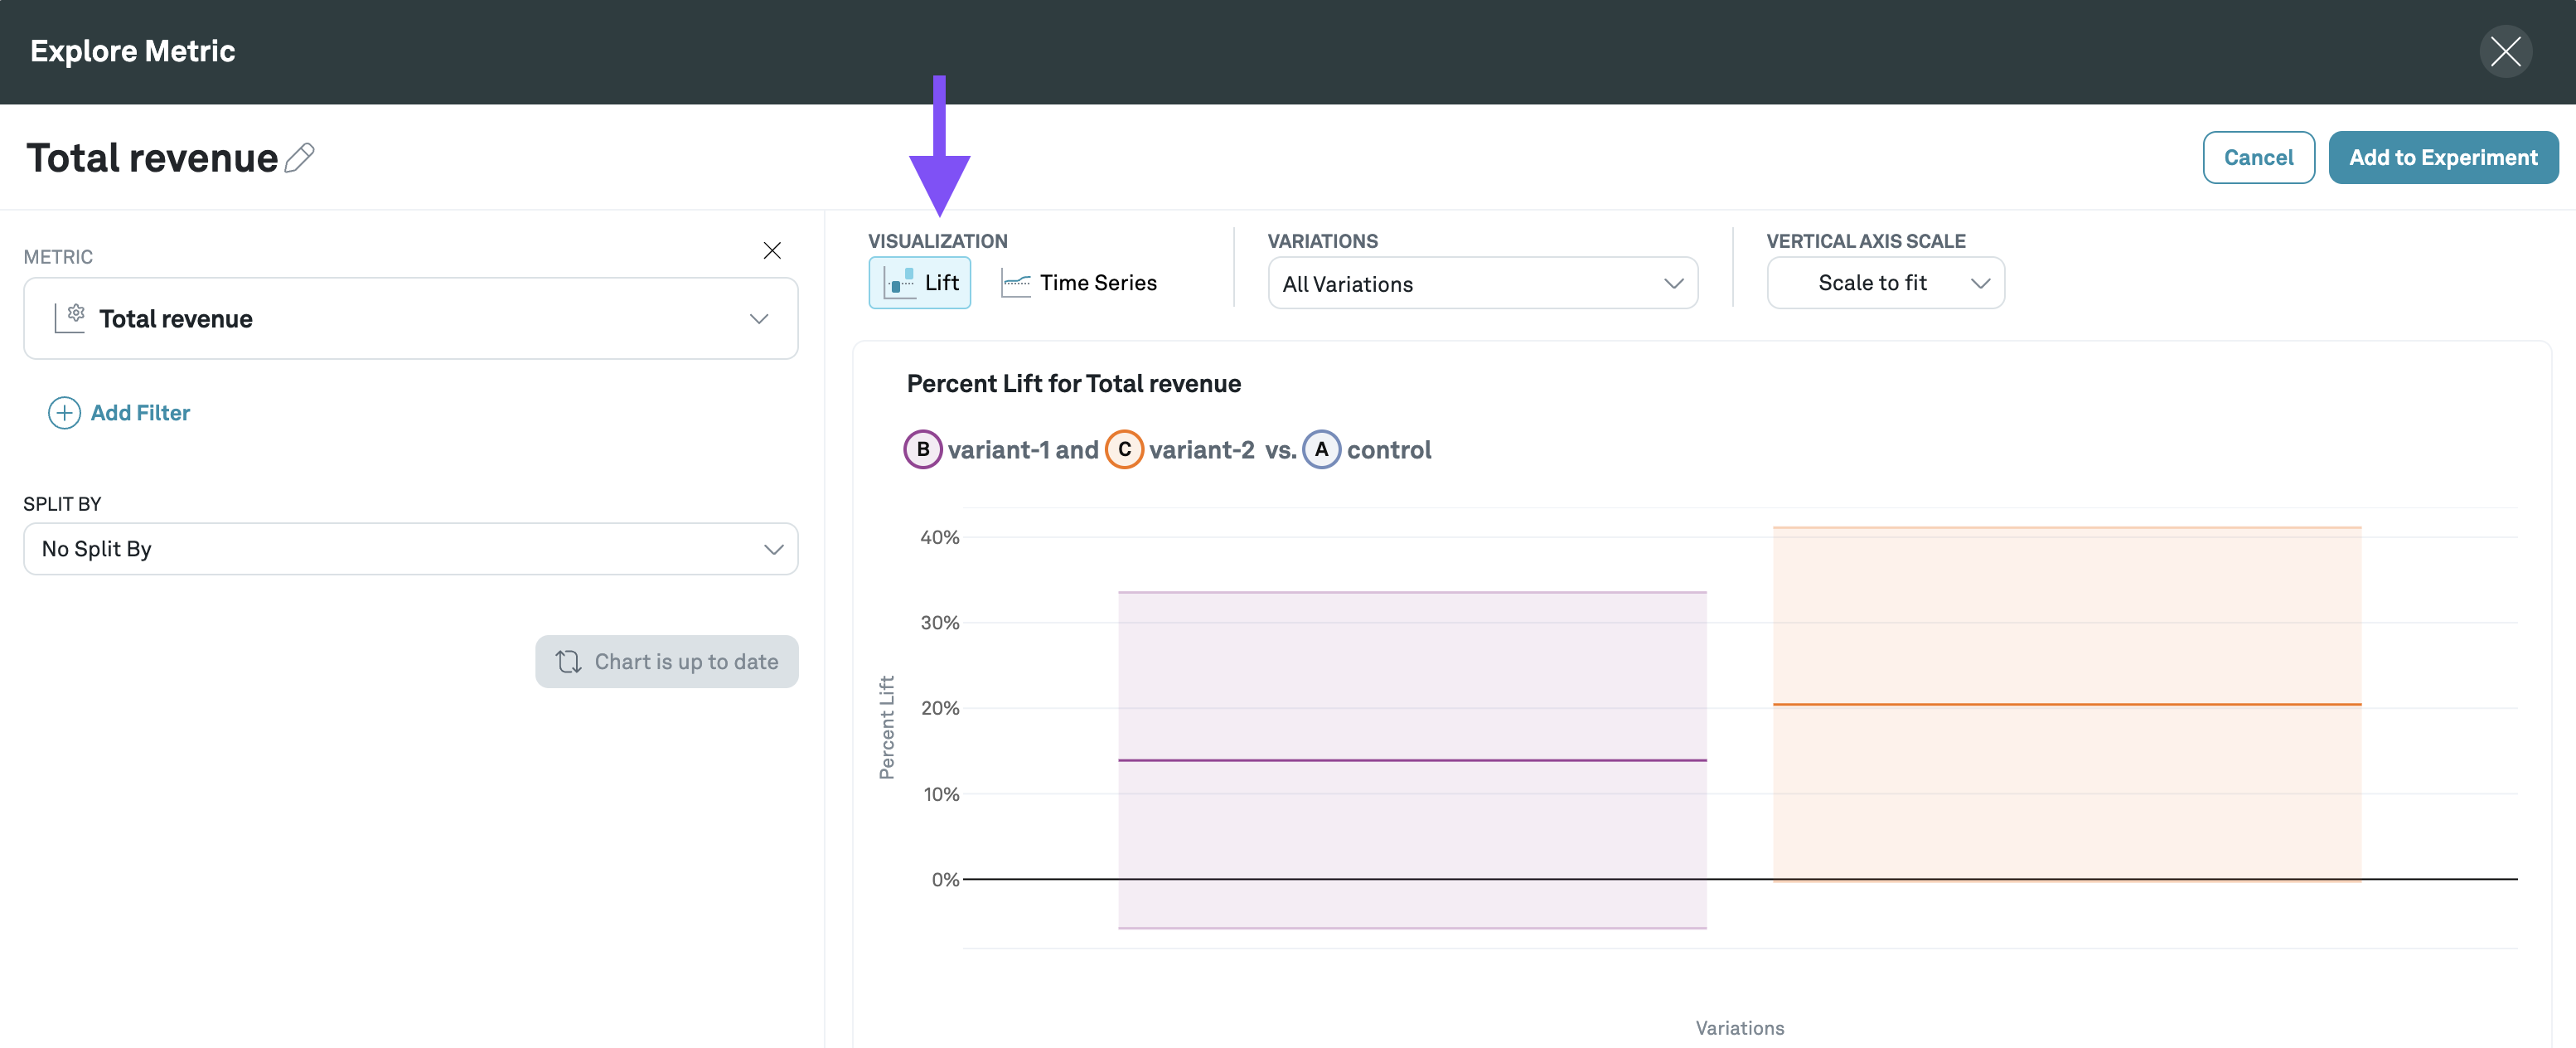
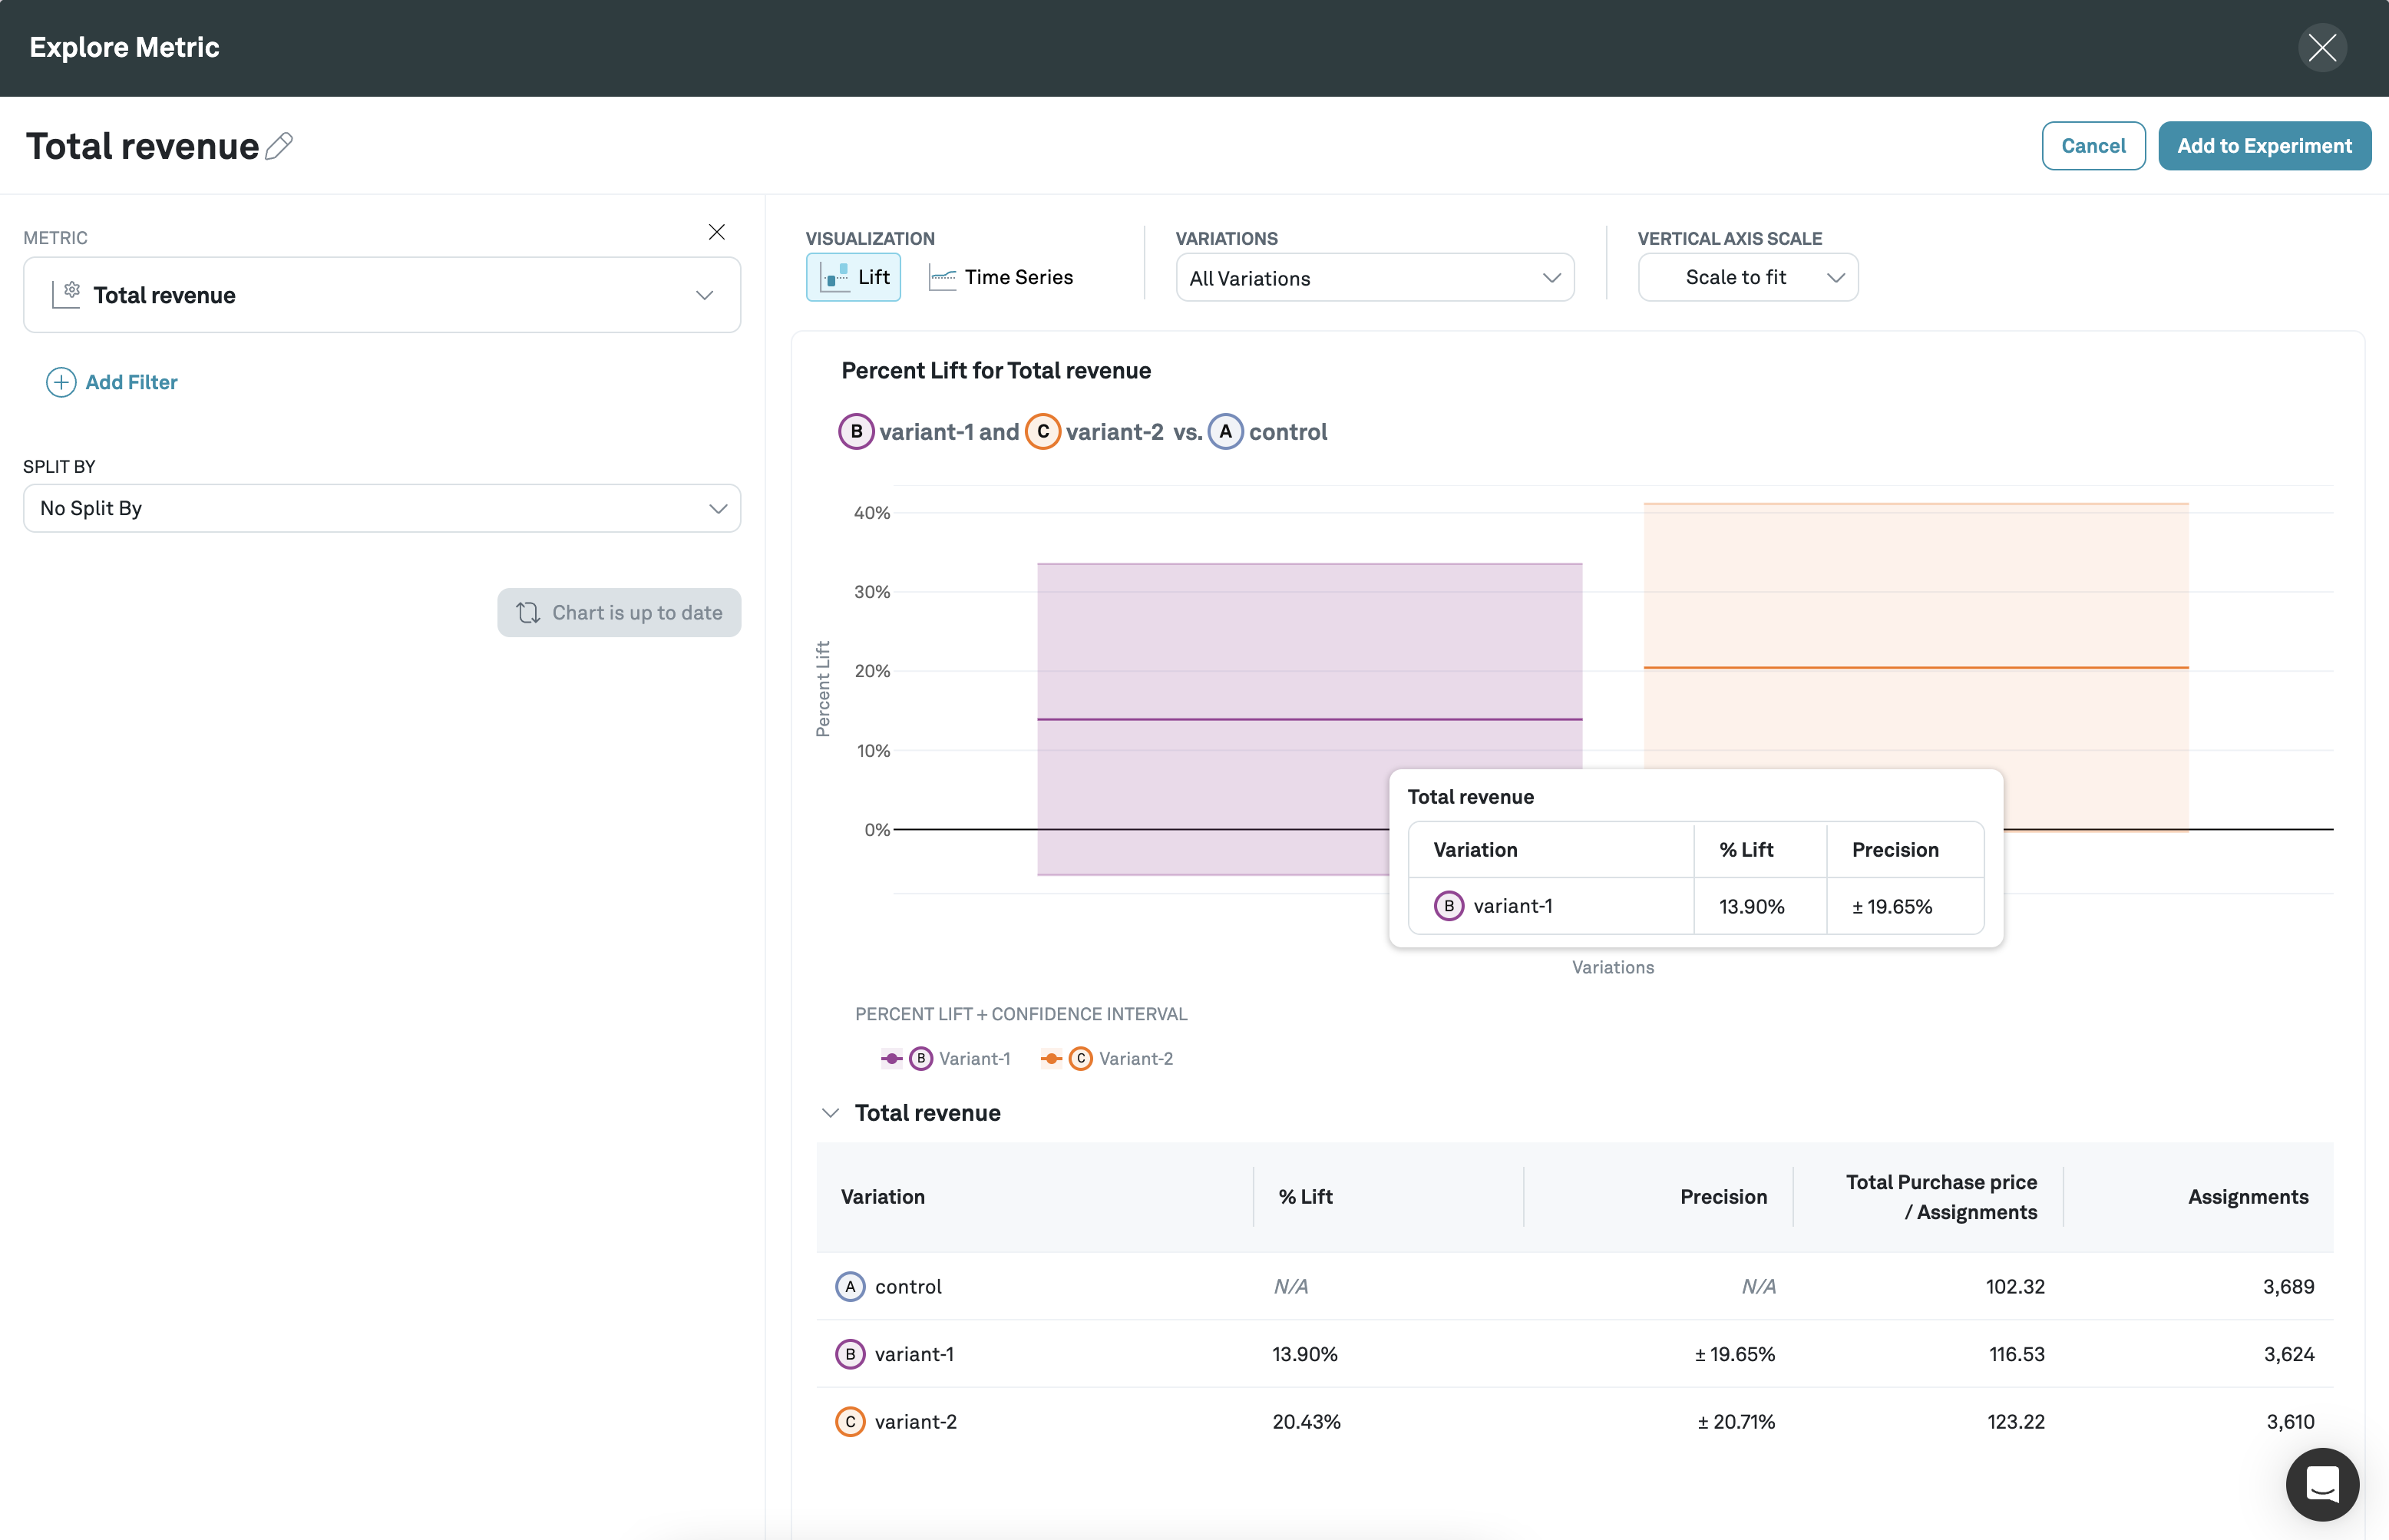
Lift
The lift chart shows the latest percent lift compared to the control. The lift compared to the control is shown as the center line, and the confidence interval bands are shown in the lower opacity blocks. Confidence interval bands that do not cross the 0% lift are considered statistically significant.
If there is not enough data to calculate the confidence of a lift, then the bands will be shown in a gradient fading out from the center line.
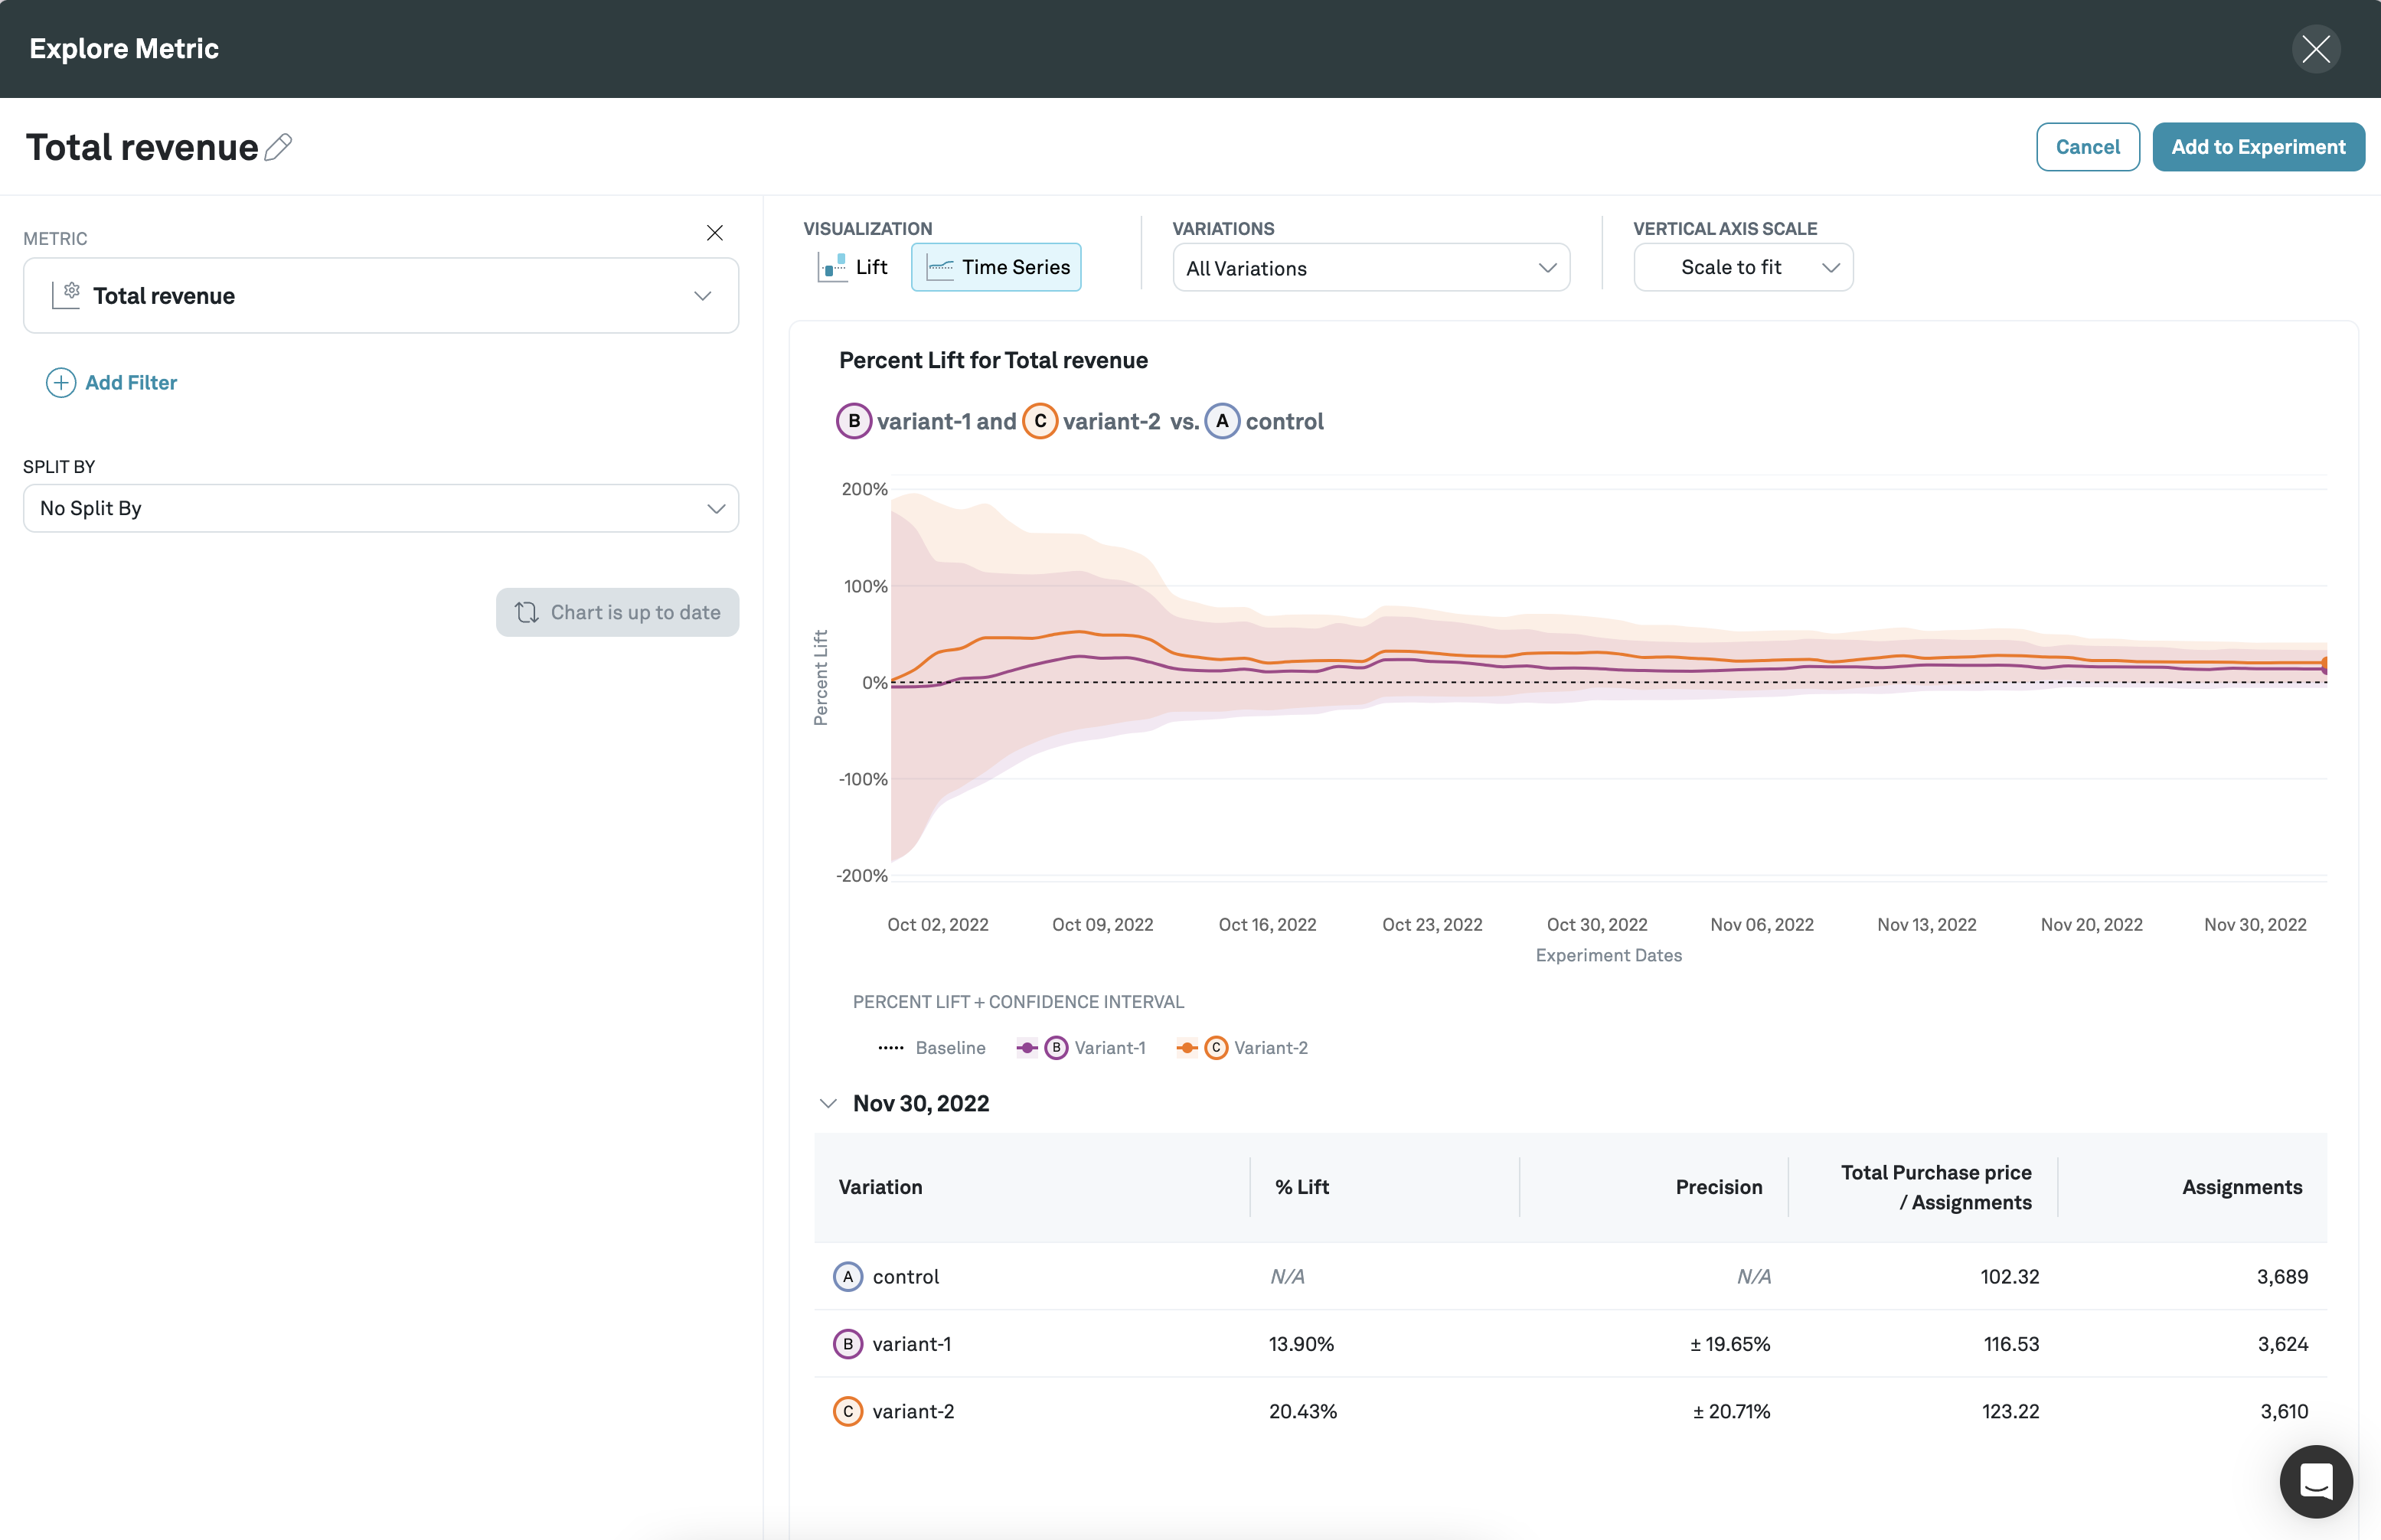
Time Series
The time series chart shows how the percent lift and precision change over the duration of the experiment. The lift compared to the control is shown as the center line, and the confidence interval bands are shown in the lower opacity shading.
If there is not enough data to calculate the confidence of a lift, then the bands will be shown in a gradient fading out from the center line.
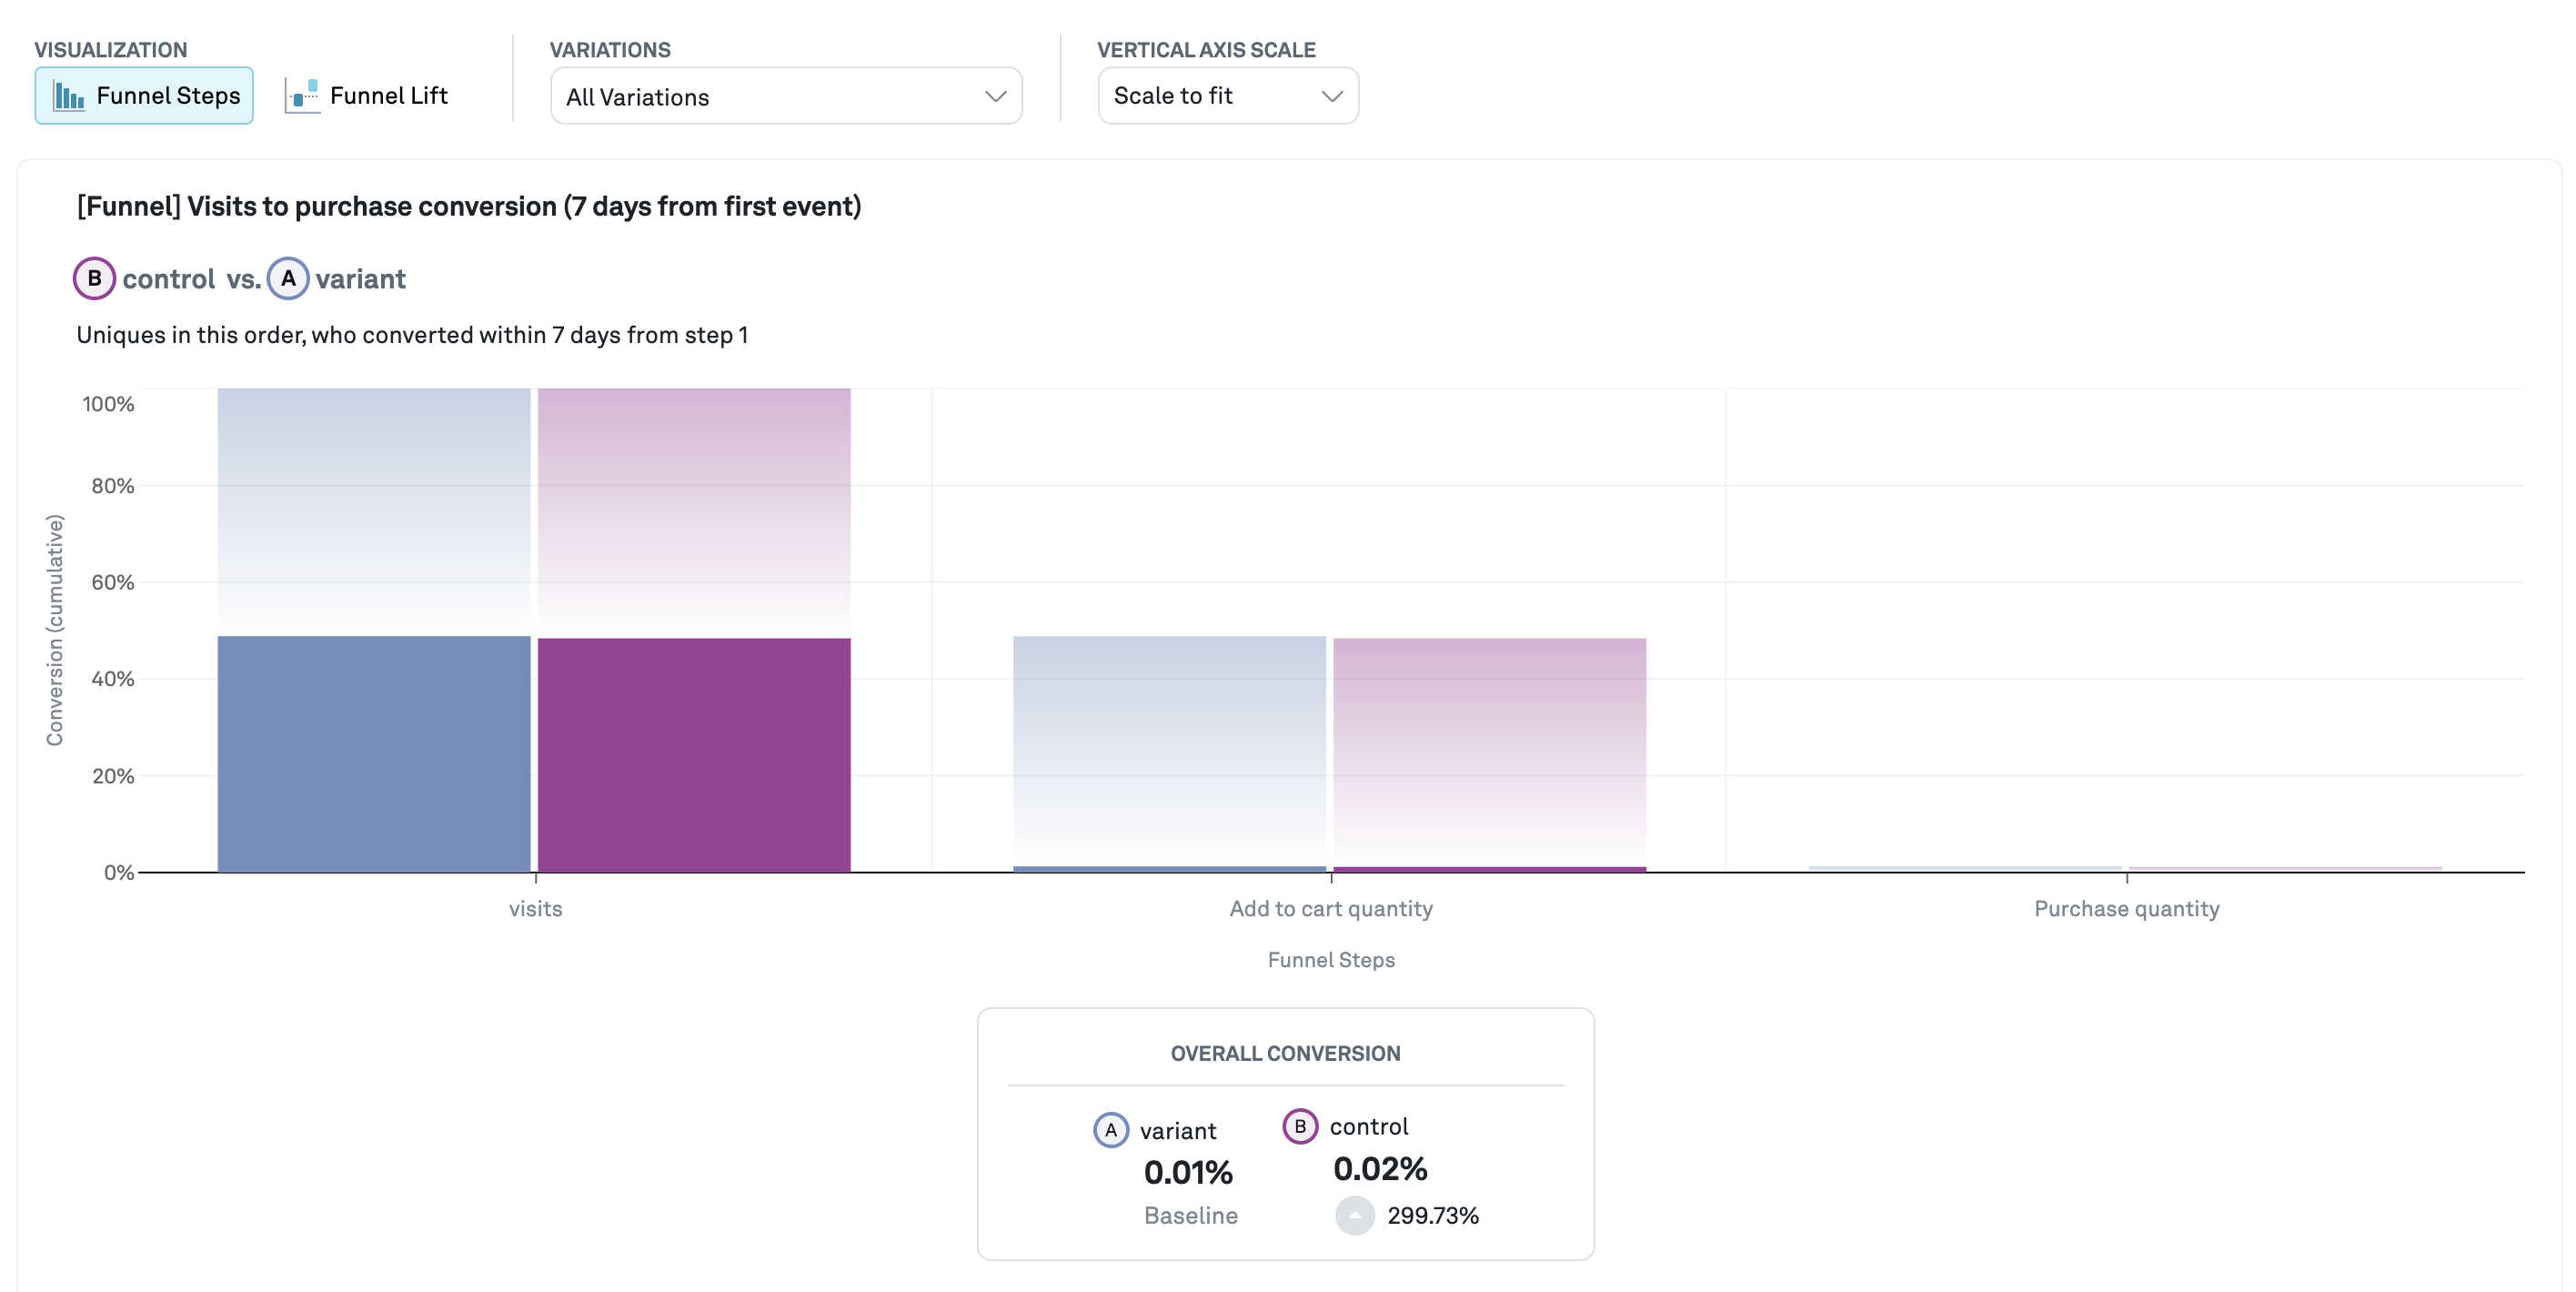
Funnel Steps
This chart only applies to funnel metrics. The funnel steps visualization shows how each step of the funnel converted (cumulatively). The solid bars represent the conversion from assignment into the experiment and the gradient represents the drop-off. You can view further details and the survivor count in the tables below.