Analyzing your first experiment
In order to analyze an experiment, you must have completed the initial setup quick start and created your first metric.
This guide will walk you through creating your first experiment readout. We will create a new experiment analysis, set up basic configurations, add metrics, run the analysis, and visualize results.
1. Create an Assignment SQL definition
This step is only required when first integrating Eppo. If your company is already using Eppo to measure experiments, you may be able to skip this step.
At the core of Eppo's data model is a log of every time a subject (e.g., user) was assigned to an experiment and which variant they received. These logs can capture both experiments randomized with Eppo as well as with other tools (for instance, email marketing systems). If you have not run an experiment before, see our guide on running your first experiment.
To add an assignment log, navigate to the Assignments section on the Definitions tab and click +Create Assignment Table. Give the Assignment SQL a name (e.g., "Eppo Randomized Assignments") and write SQL to return the following fields from your data warehouse:
- A unique identifier tied to the entity you created in the Initial Setup quick start (e.g.,
user_id) - An experiment key specifying the experiment into which the subject (user) was enrolled
- The variant the subject (user) received
- The timestamp that the assignment occurred
- (Optional) any user-level properties that you would like to use to break out experiment results (country, browser, user persona, etc.)
For Eppo-randomized experiments, these fields all exist in the assignment object passed to the logging callback function.
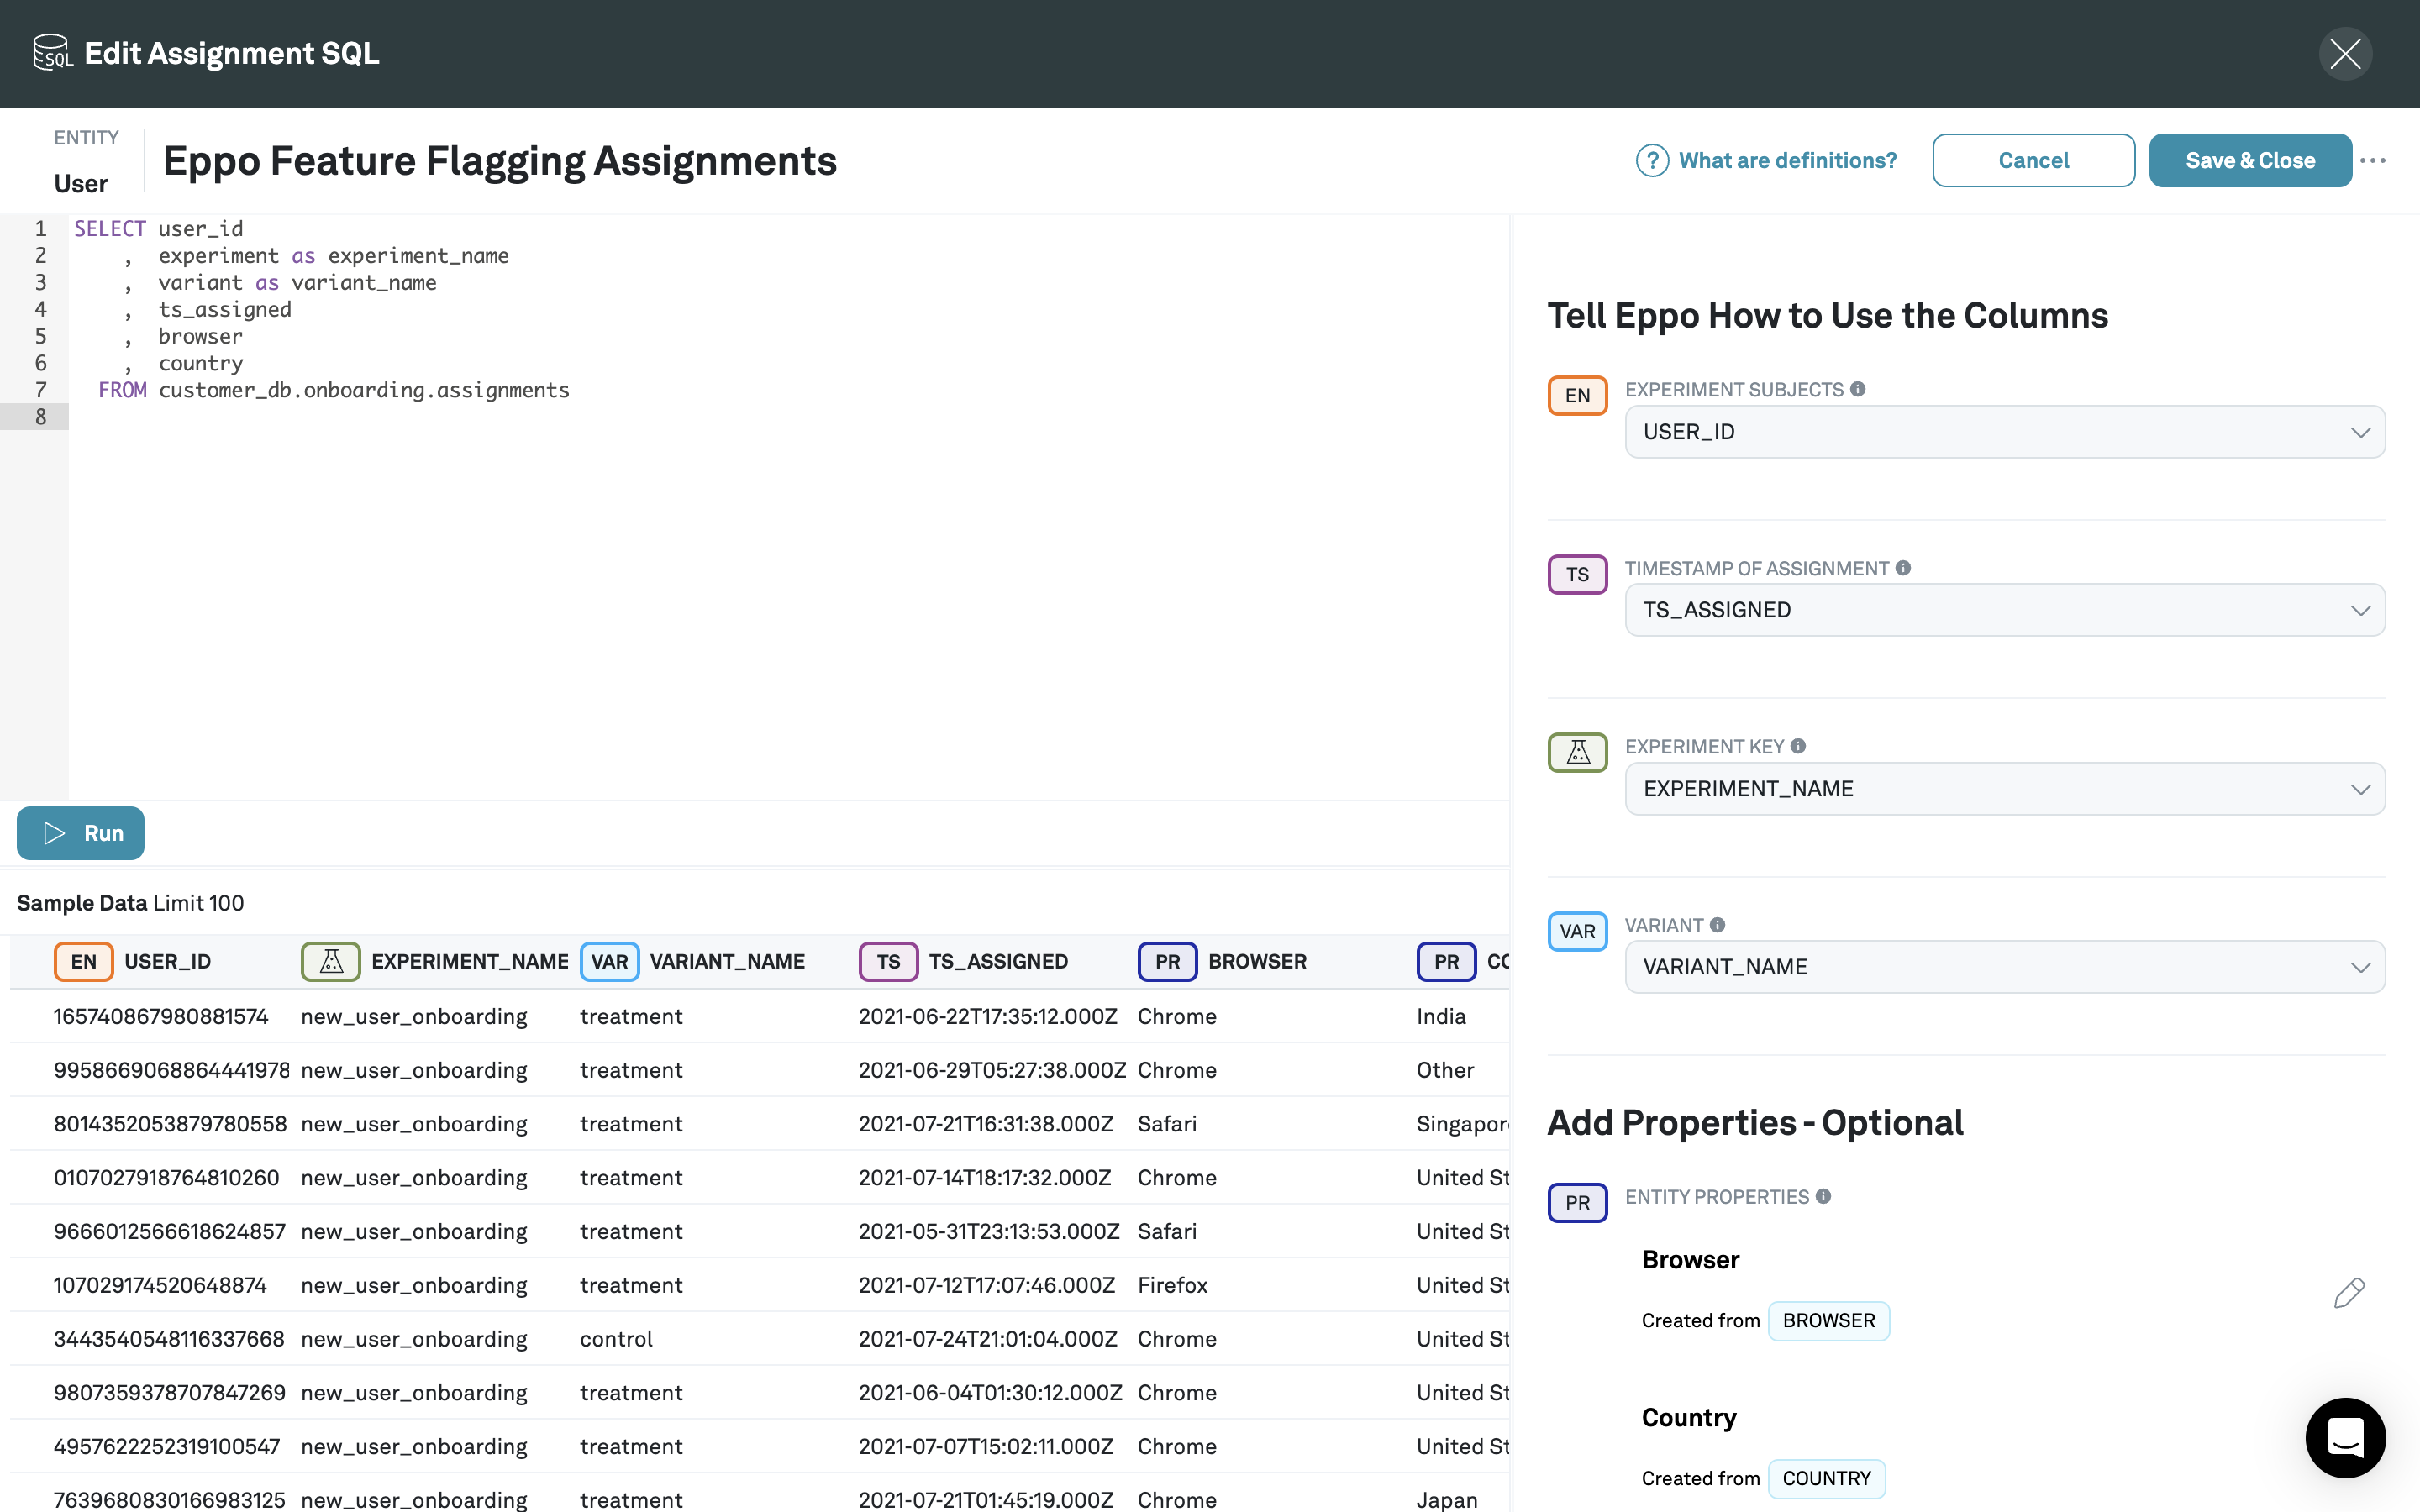
Once this query has been written, pull in a sample data set by clicking Run and tell Eppo how to use the columns in the right panel.
You can read more about Assignment SQL Definitions here.
2. Create an experiment analysis
- Eppo Randomized
- Externally Randomized
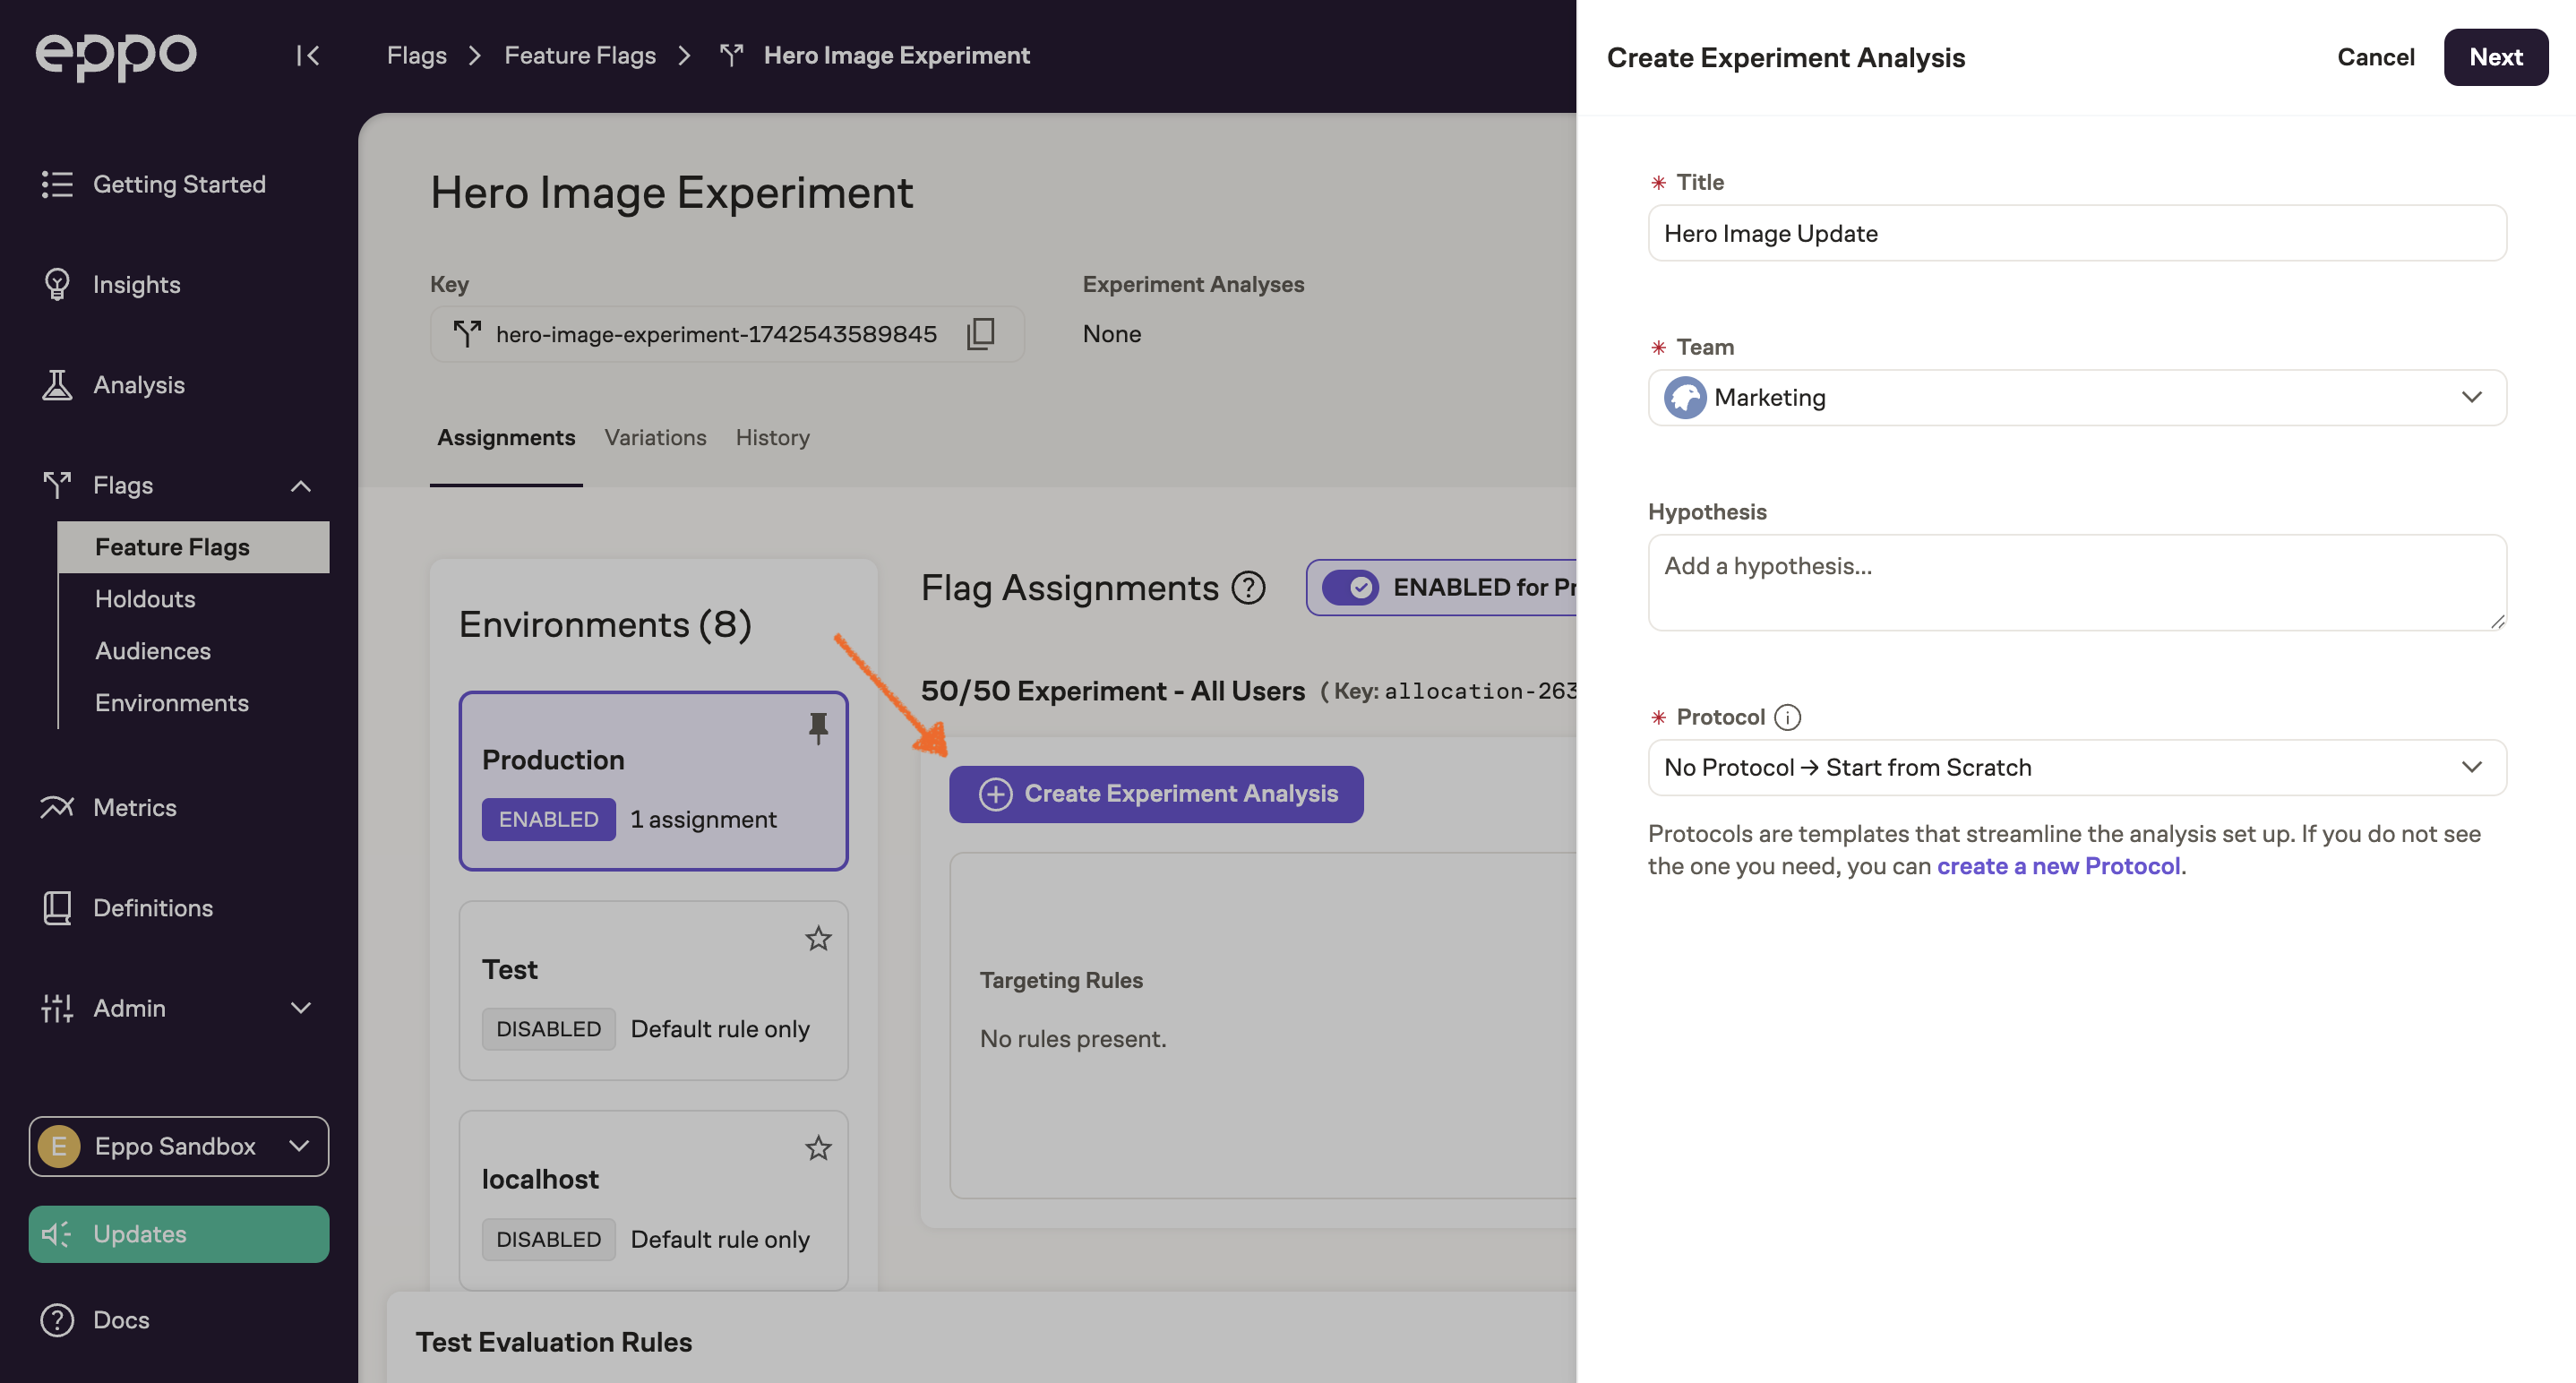
From your Feature Flag, click Create Experiment Analysis. Give the experiment a name and add an optional hypothesis. If you have already set up Experiment Protocols, you can select one here. Otherwise, keep the default ("No Protocol -> Start from Scratch") and click Next:
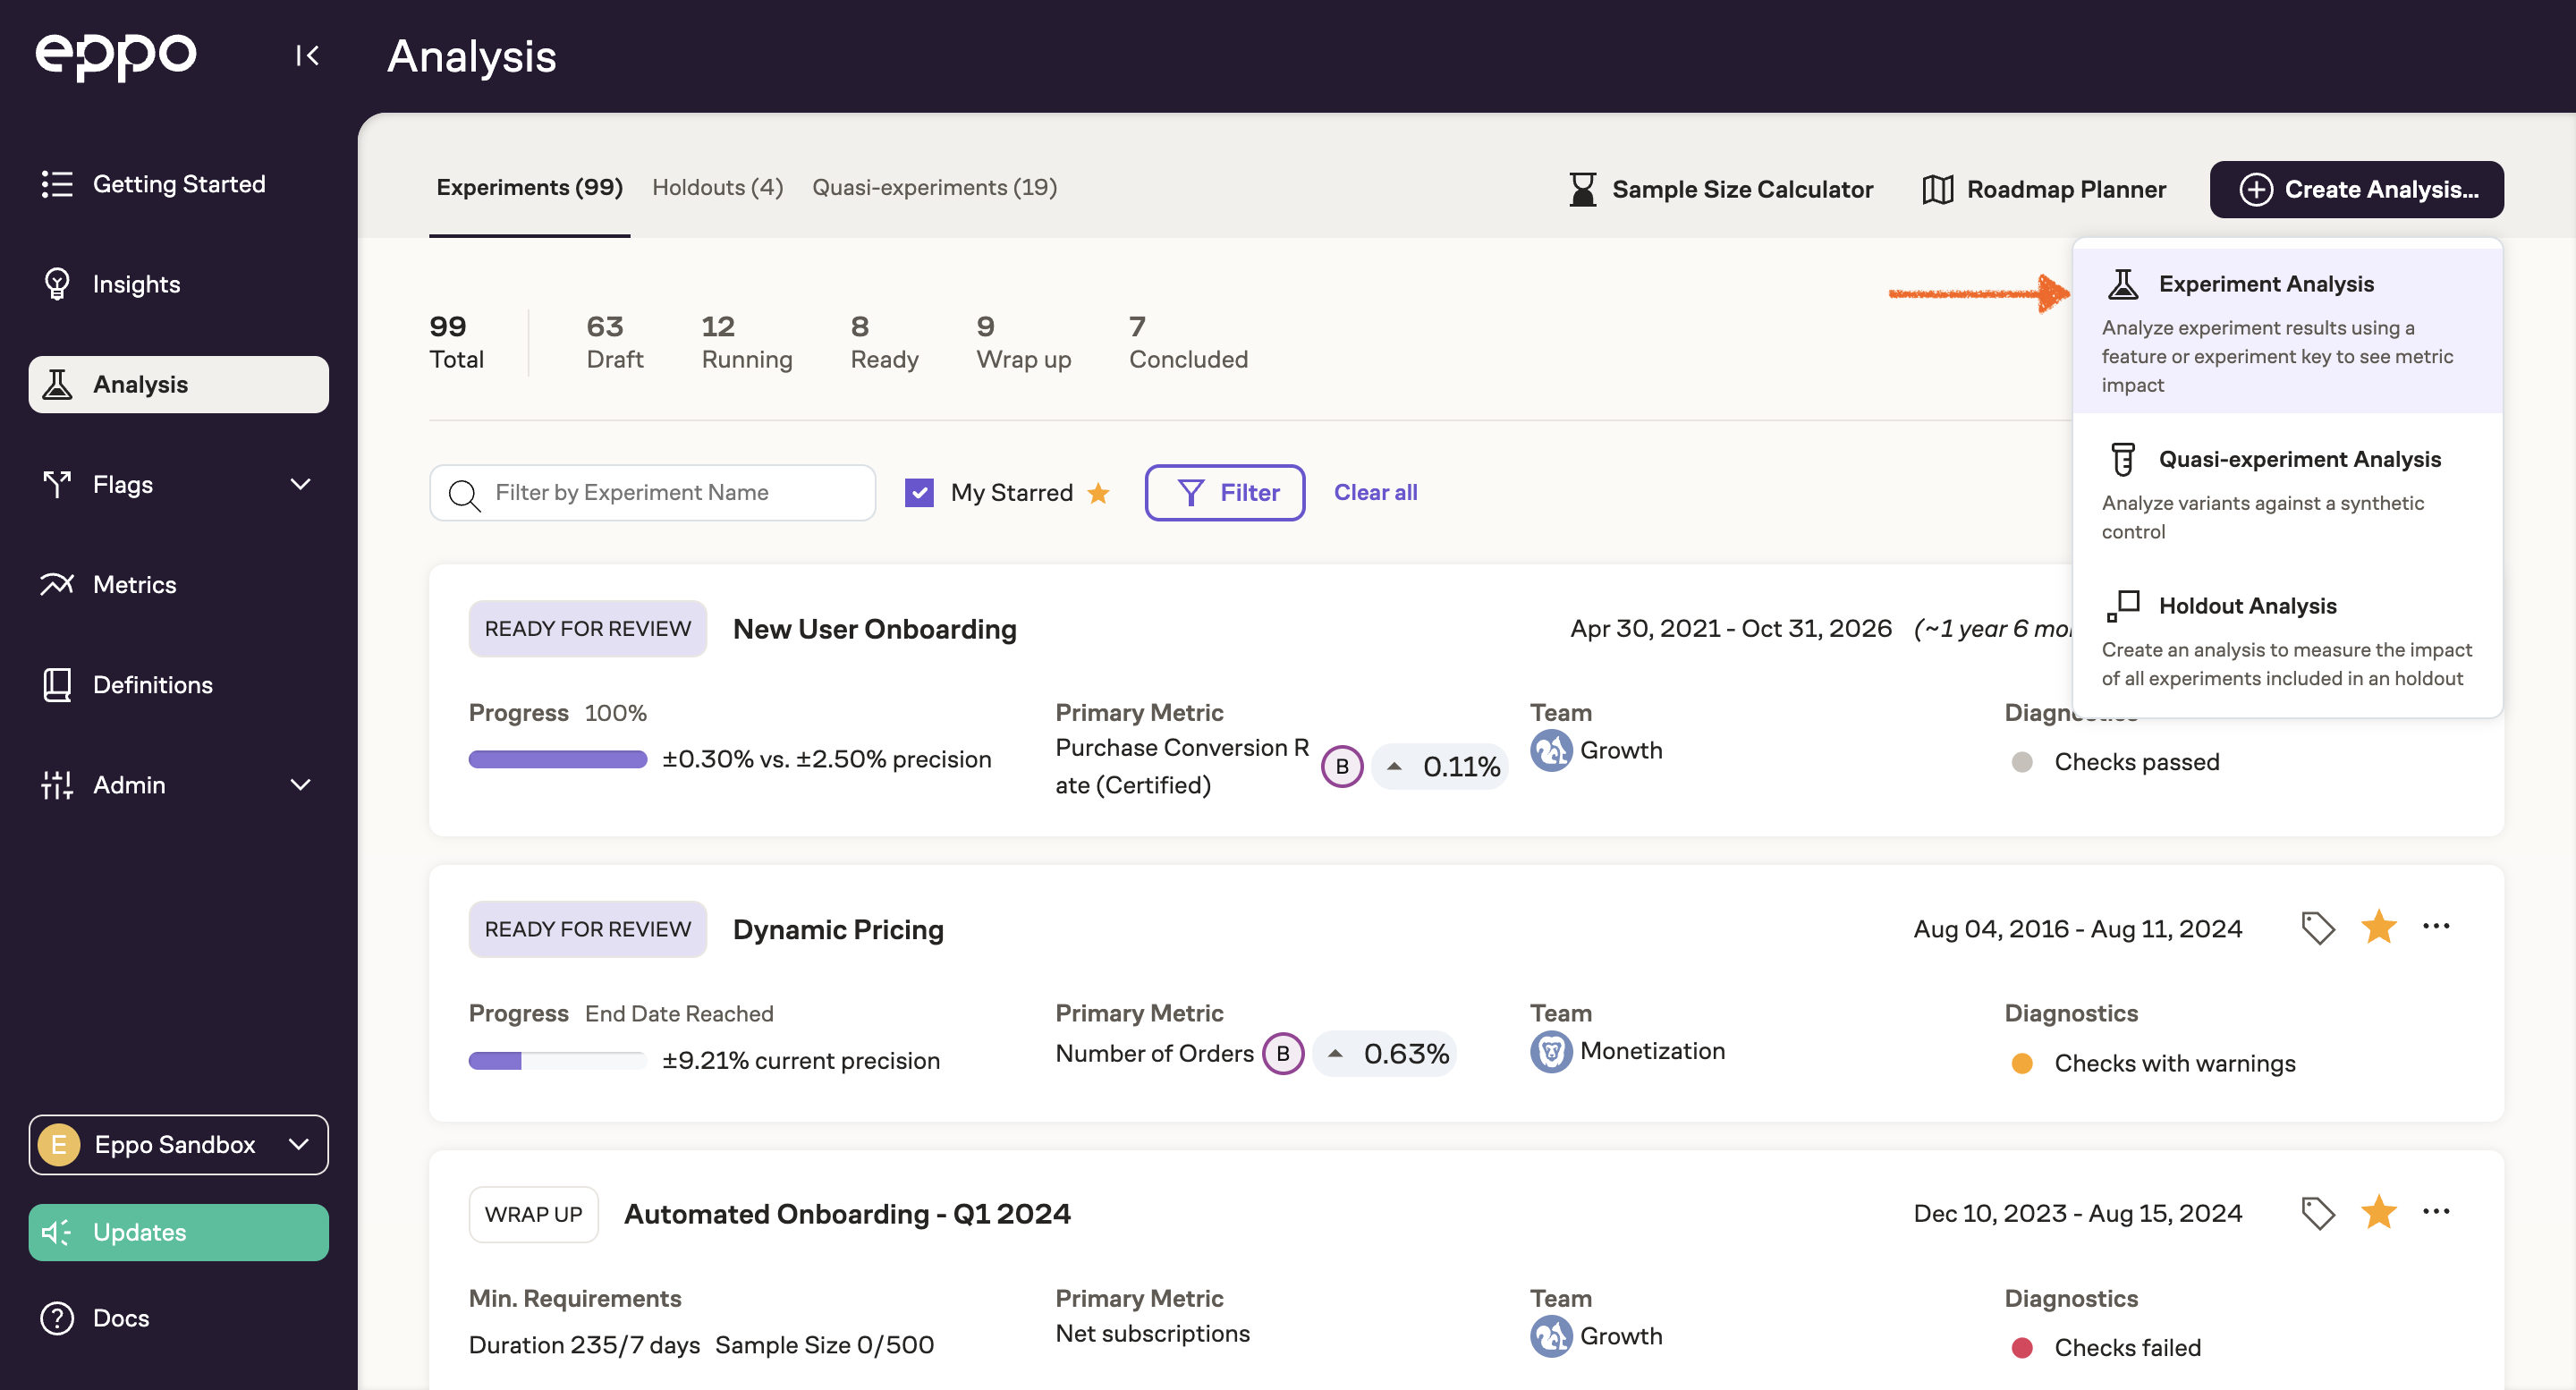
From the Analysis section, click +Create and select Experiment Analysis.
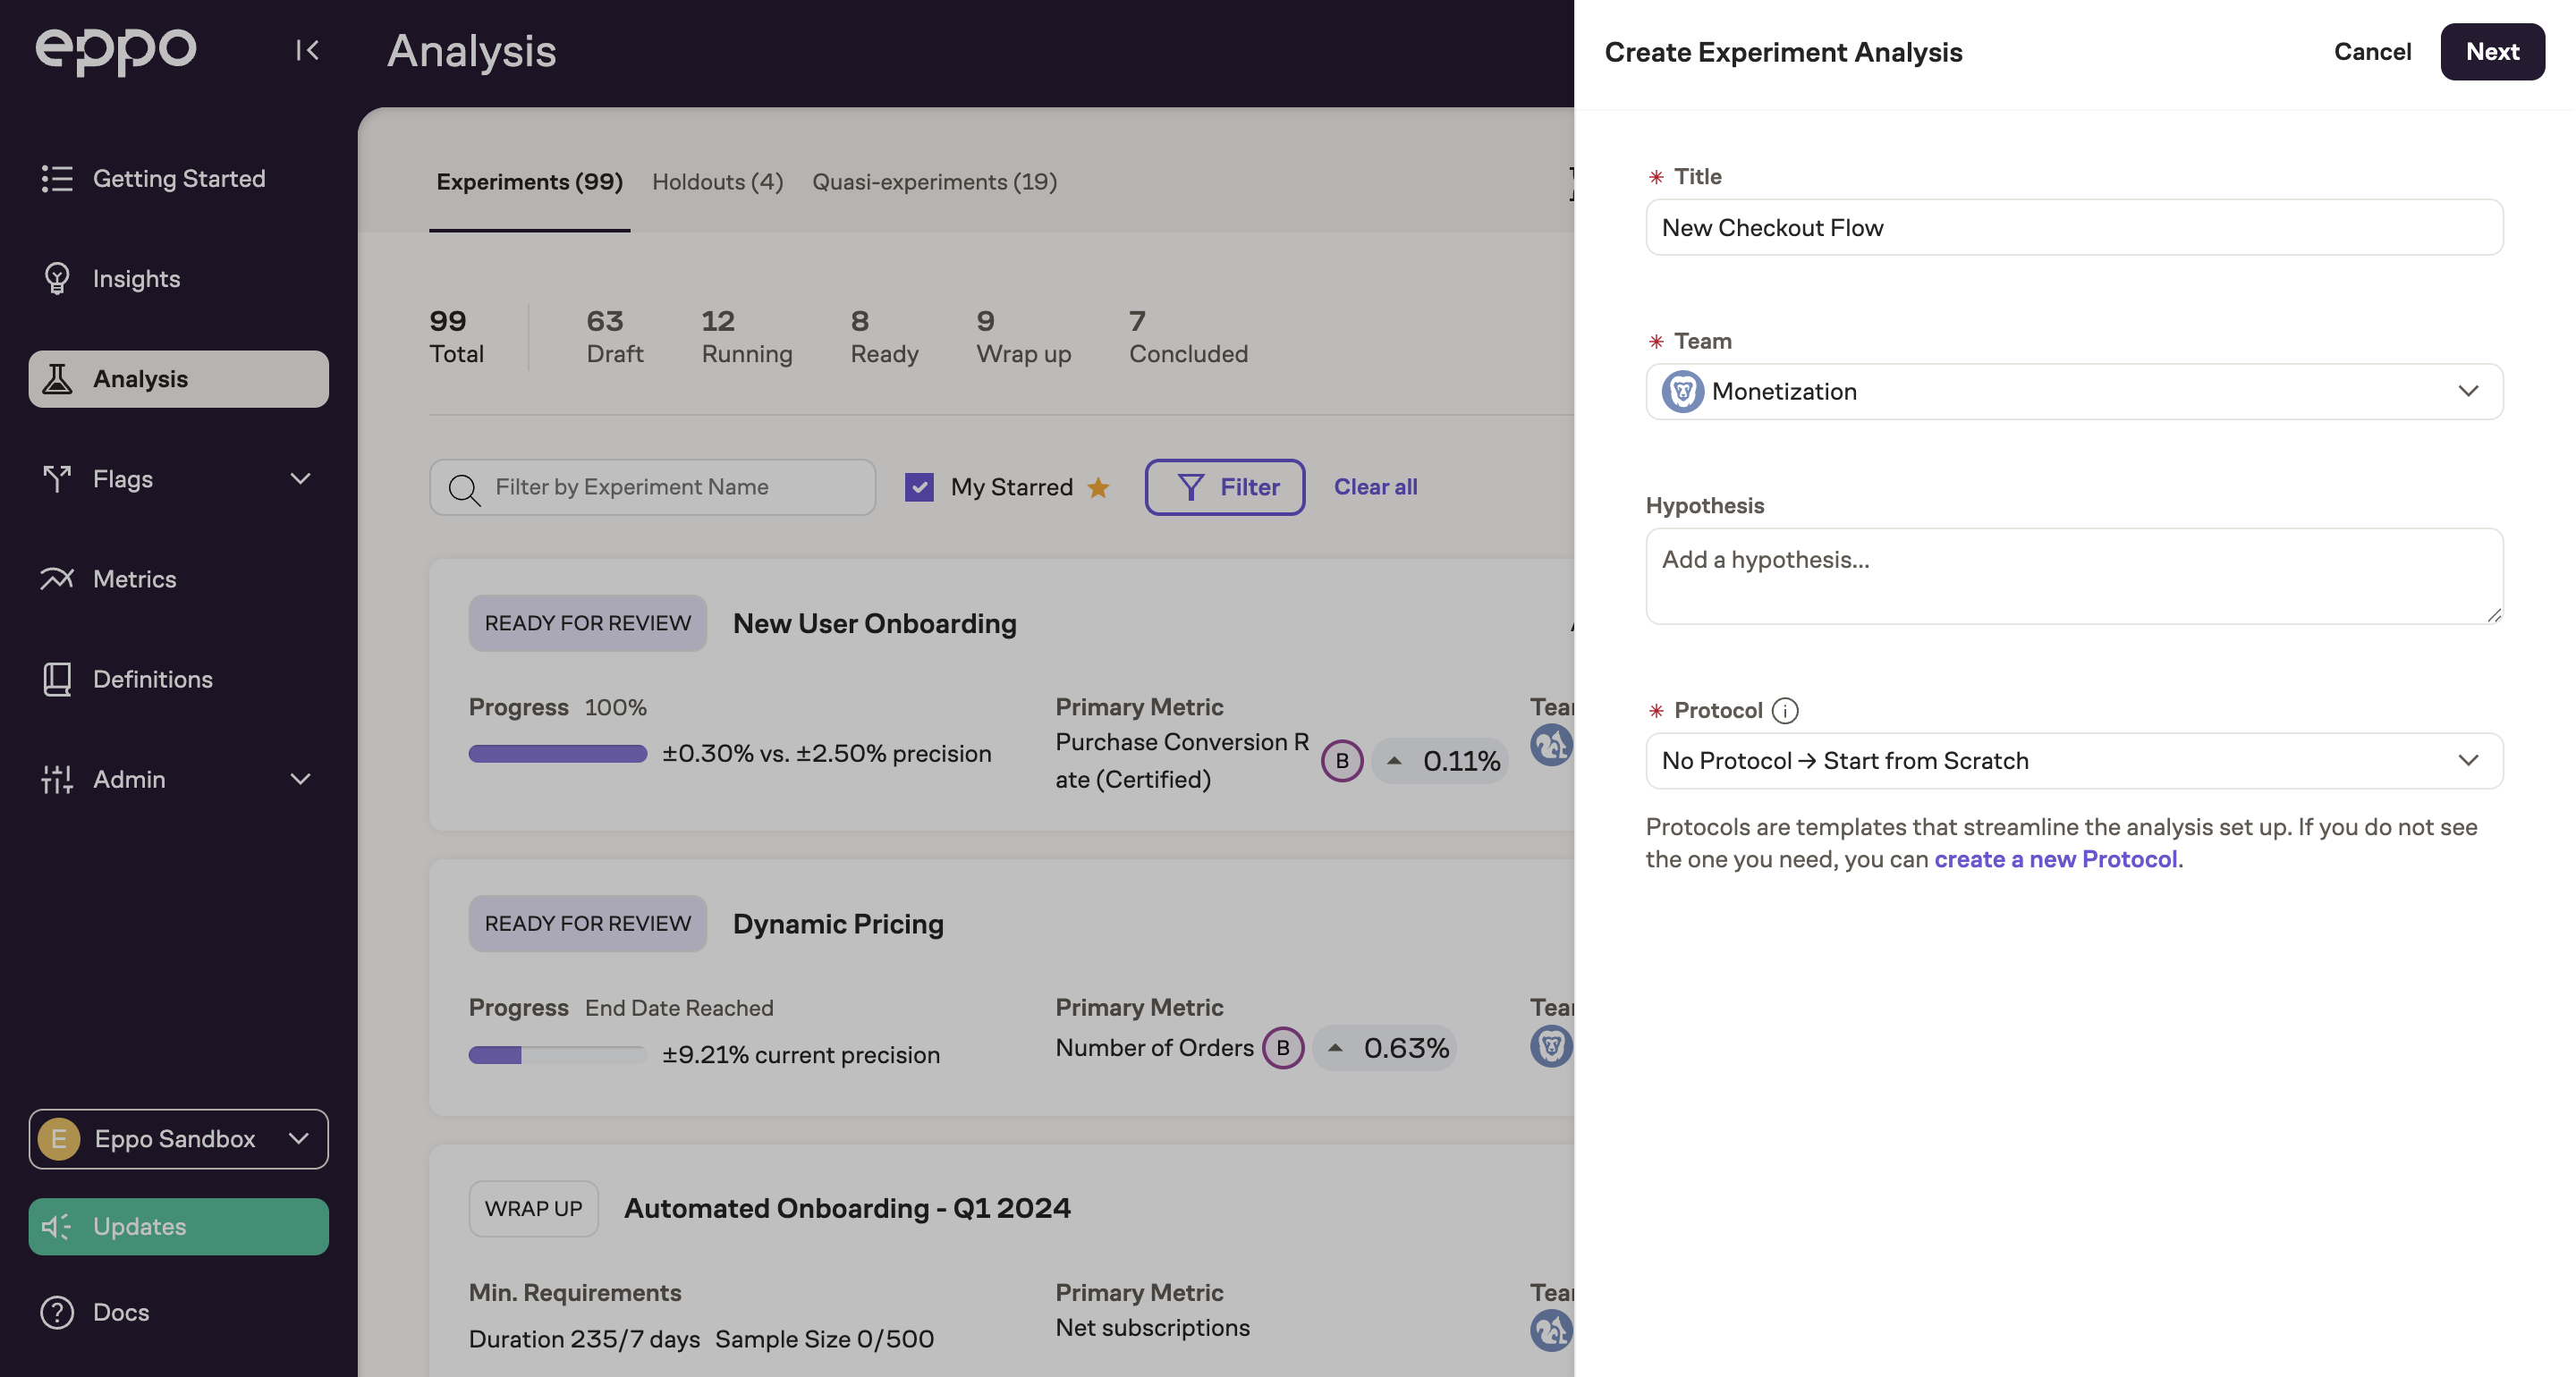
Add a name for the experiment, select an entity, and select the Assignment SQL you created above. Then, enter the experiment key that corresponds to your experiment (this will be used to filter the assignments table). Eppo will pre-populate a list of known experiment keys in a scheduled batch job, but if you do not yet see your experiment key in the dropdown you can enter it manually.
3. Configure the experiment analysis
Once you have created an experiment analysis, you'll land on the configuration page:
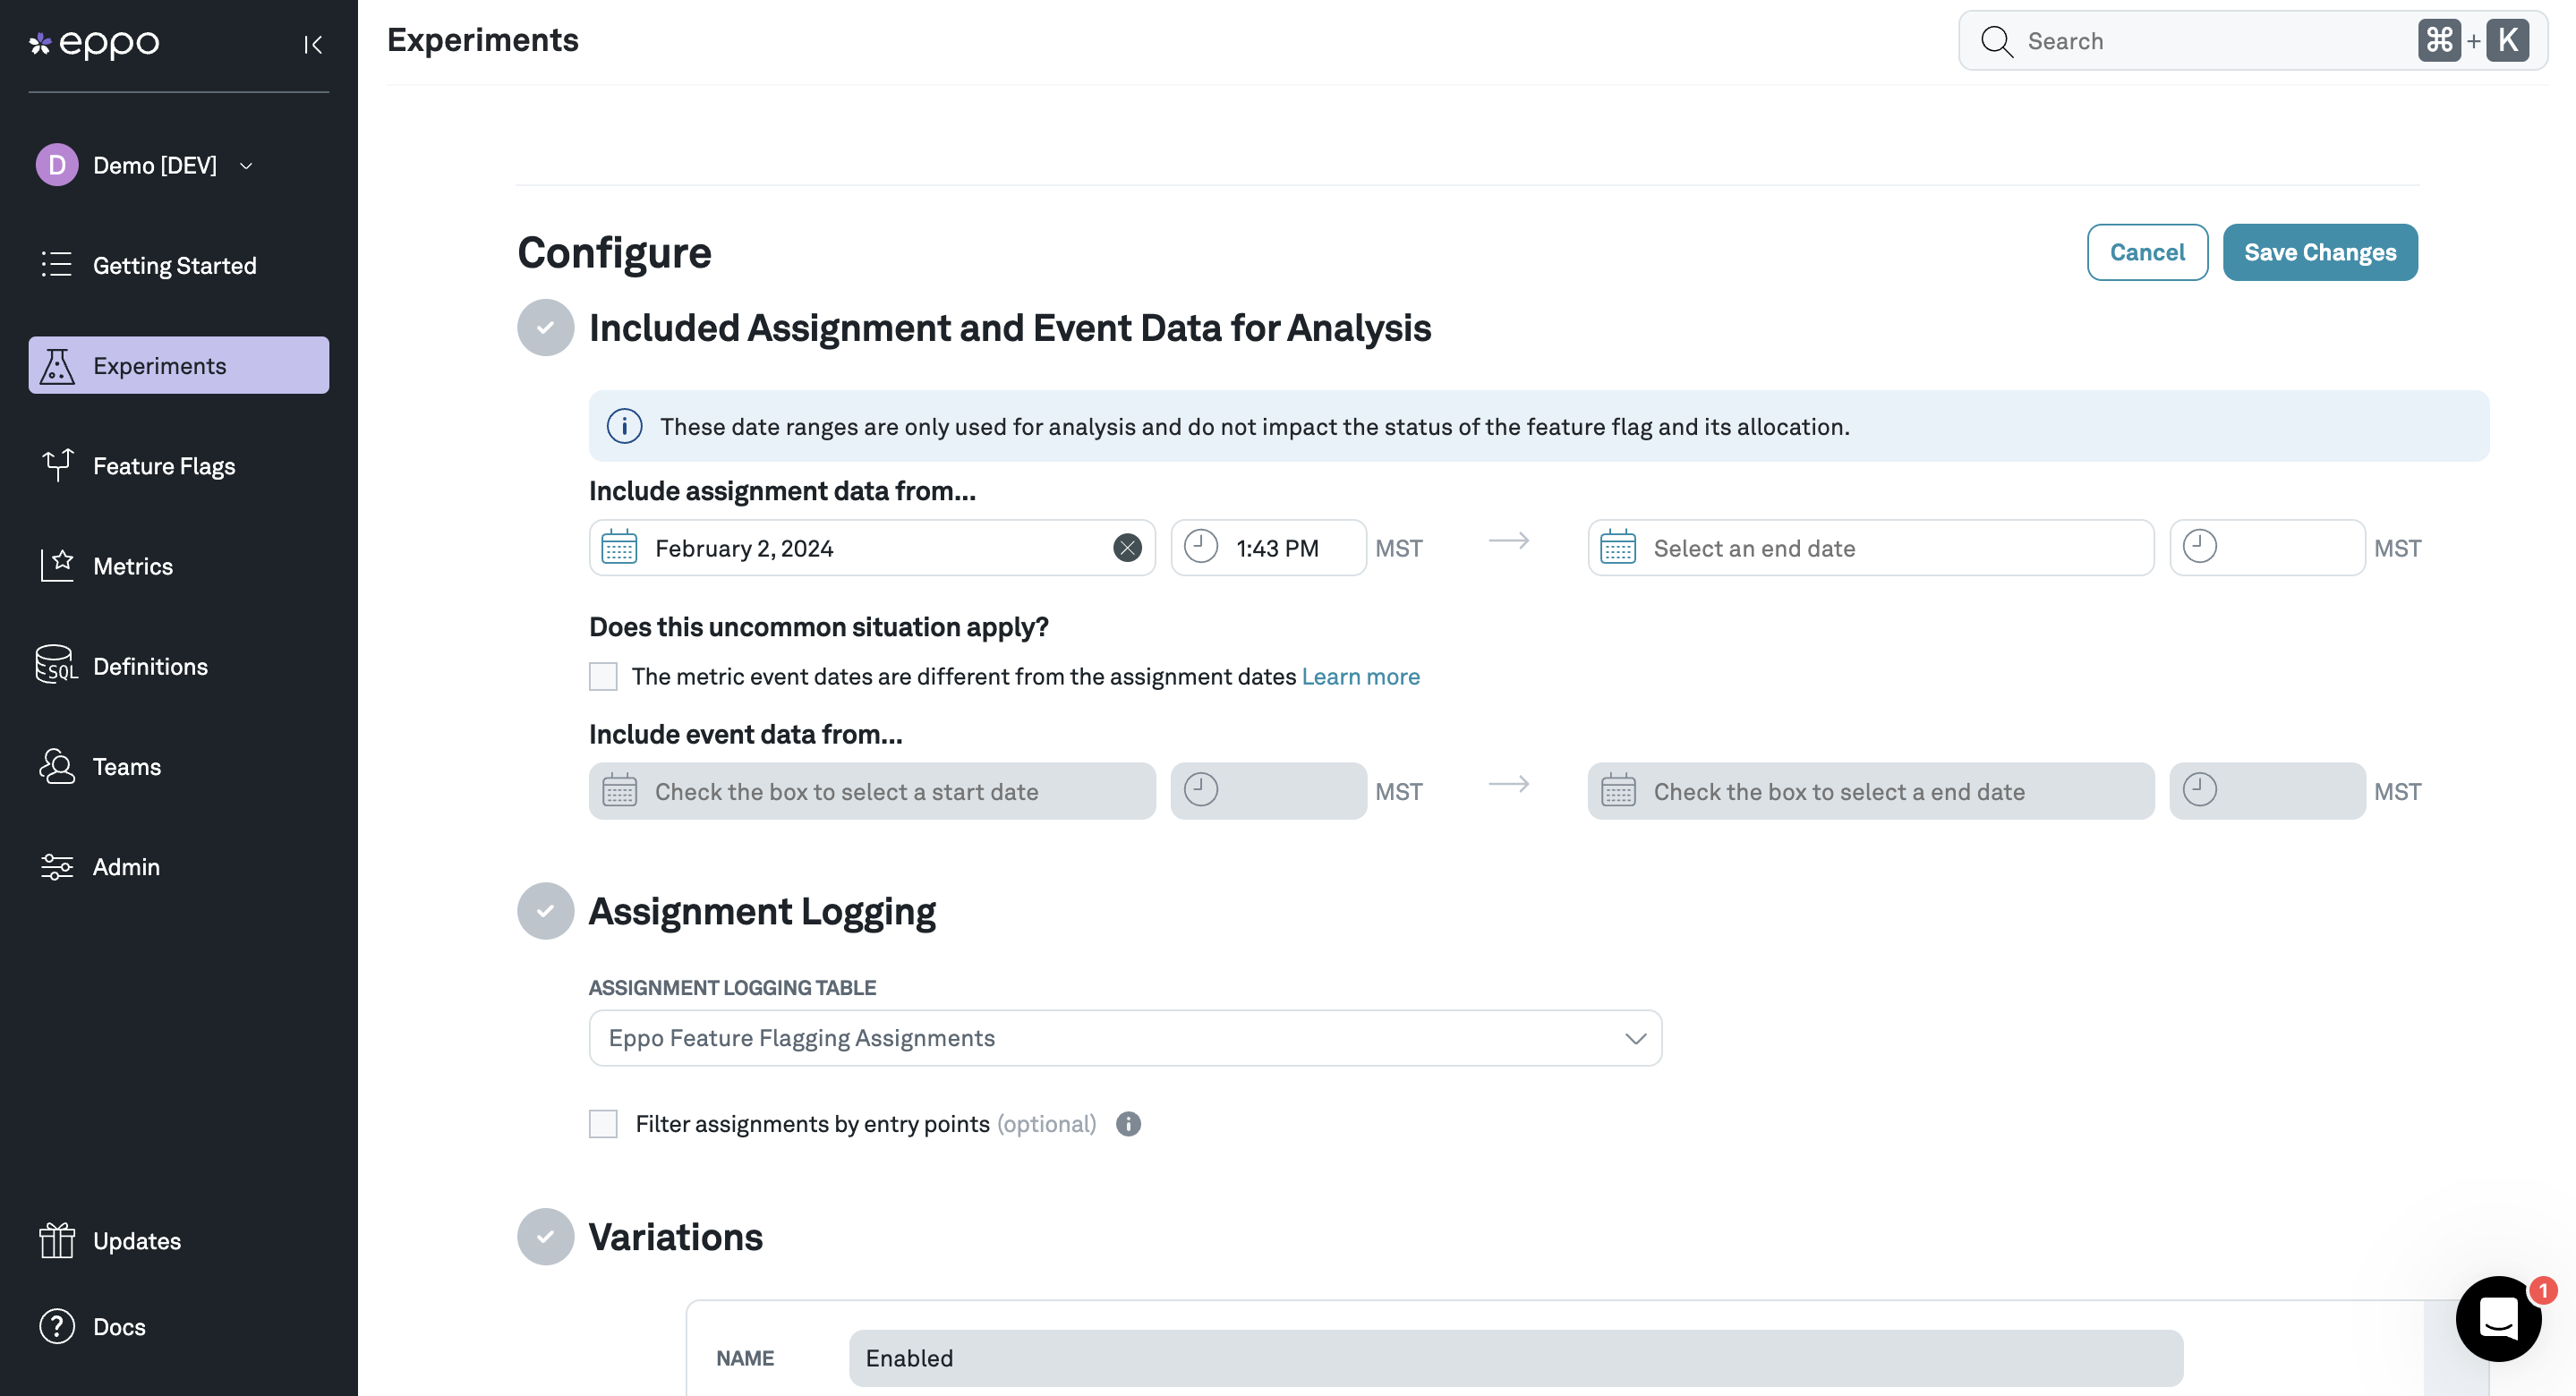
The setup flow will walk you through several sections:
-
Assignment & Analysis Date Range Use this section to tell Eppo what date range of assignments to use. You can also set a different date range for the metric events you want to include the experiment. See here for more information.
-
Variations (externally randomized experiments only) Use this section to tell Eppo the different variants that were a part of the experiment and the expected traffic allocation across groups. Eppo uses these allocation ratios to perform sample ratio mismatch checks. Eppo will scan assignment logs in a scheduled batch job, but if you don't yet see your variant values you can enter them manually.
-
Allocation (externally randomized experiments only) If your experiment has a custom traffic split or was only rolled out to a subset of eligible users (with the remainder not tracked in your assignment table), you can specify that in this section. The traffic exposure powers the Global Lift calculator. In most use cases it is appropriate to keep this exposure at 100% and the traffic split even.
-
Experiment Analysis Plan (optional) Default analysis options are set to make it easy to start using Eppo without diving deep into the details of our statistics engine. For the majority of our customers, the default settings are appropriate. If you want to dive deeper into what these settings do, please see the Analysis Plan section of our docs.
Once you have configured your experiment, click Save Changes and continue on to adding metrics.
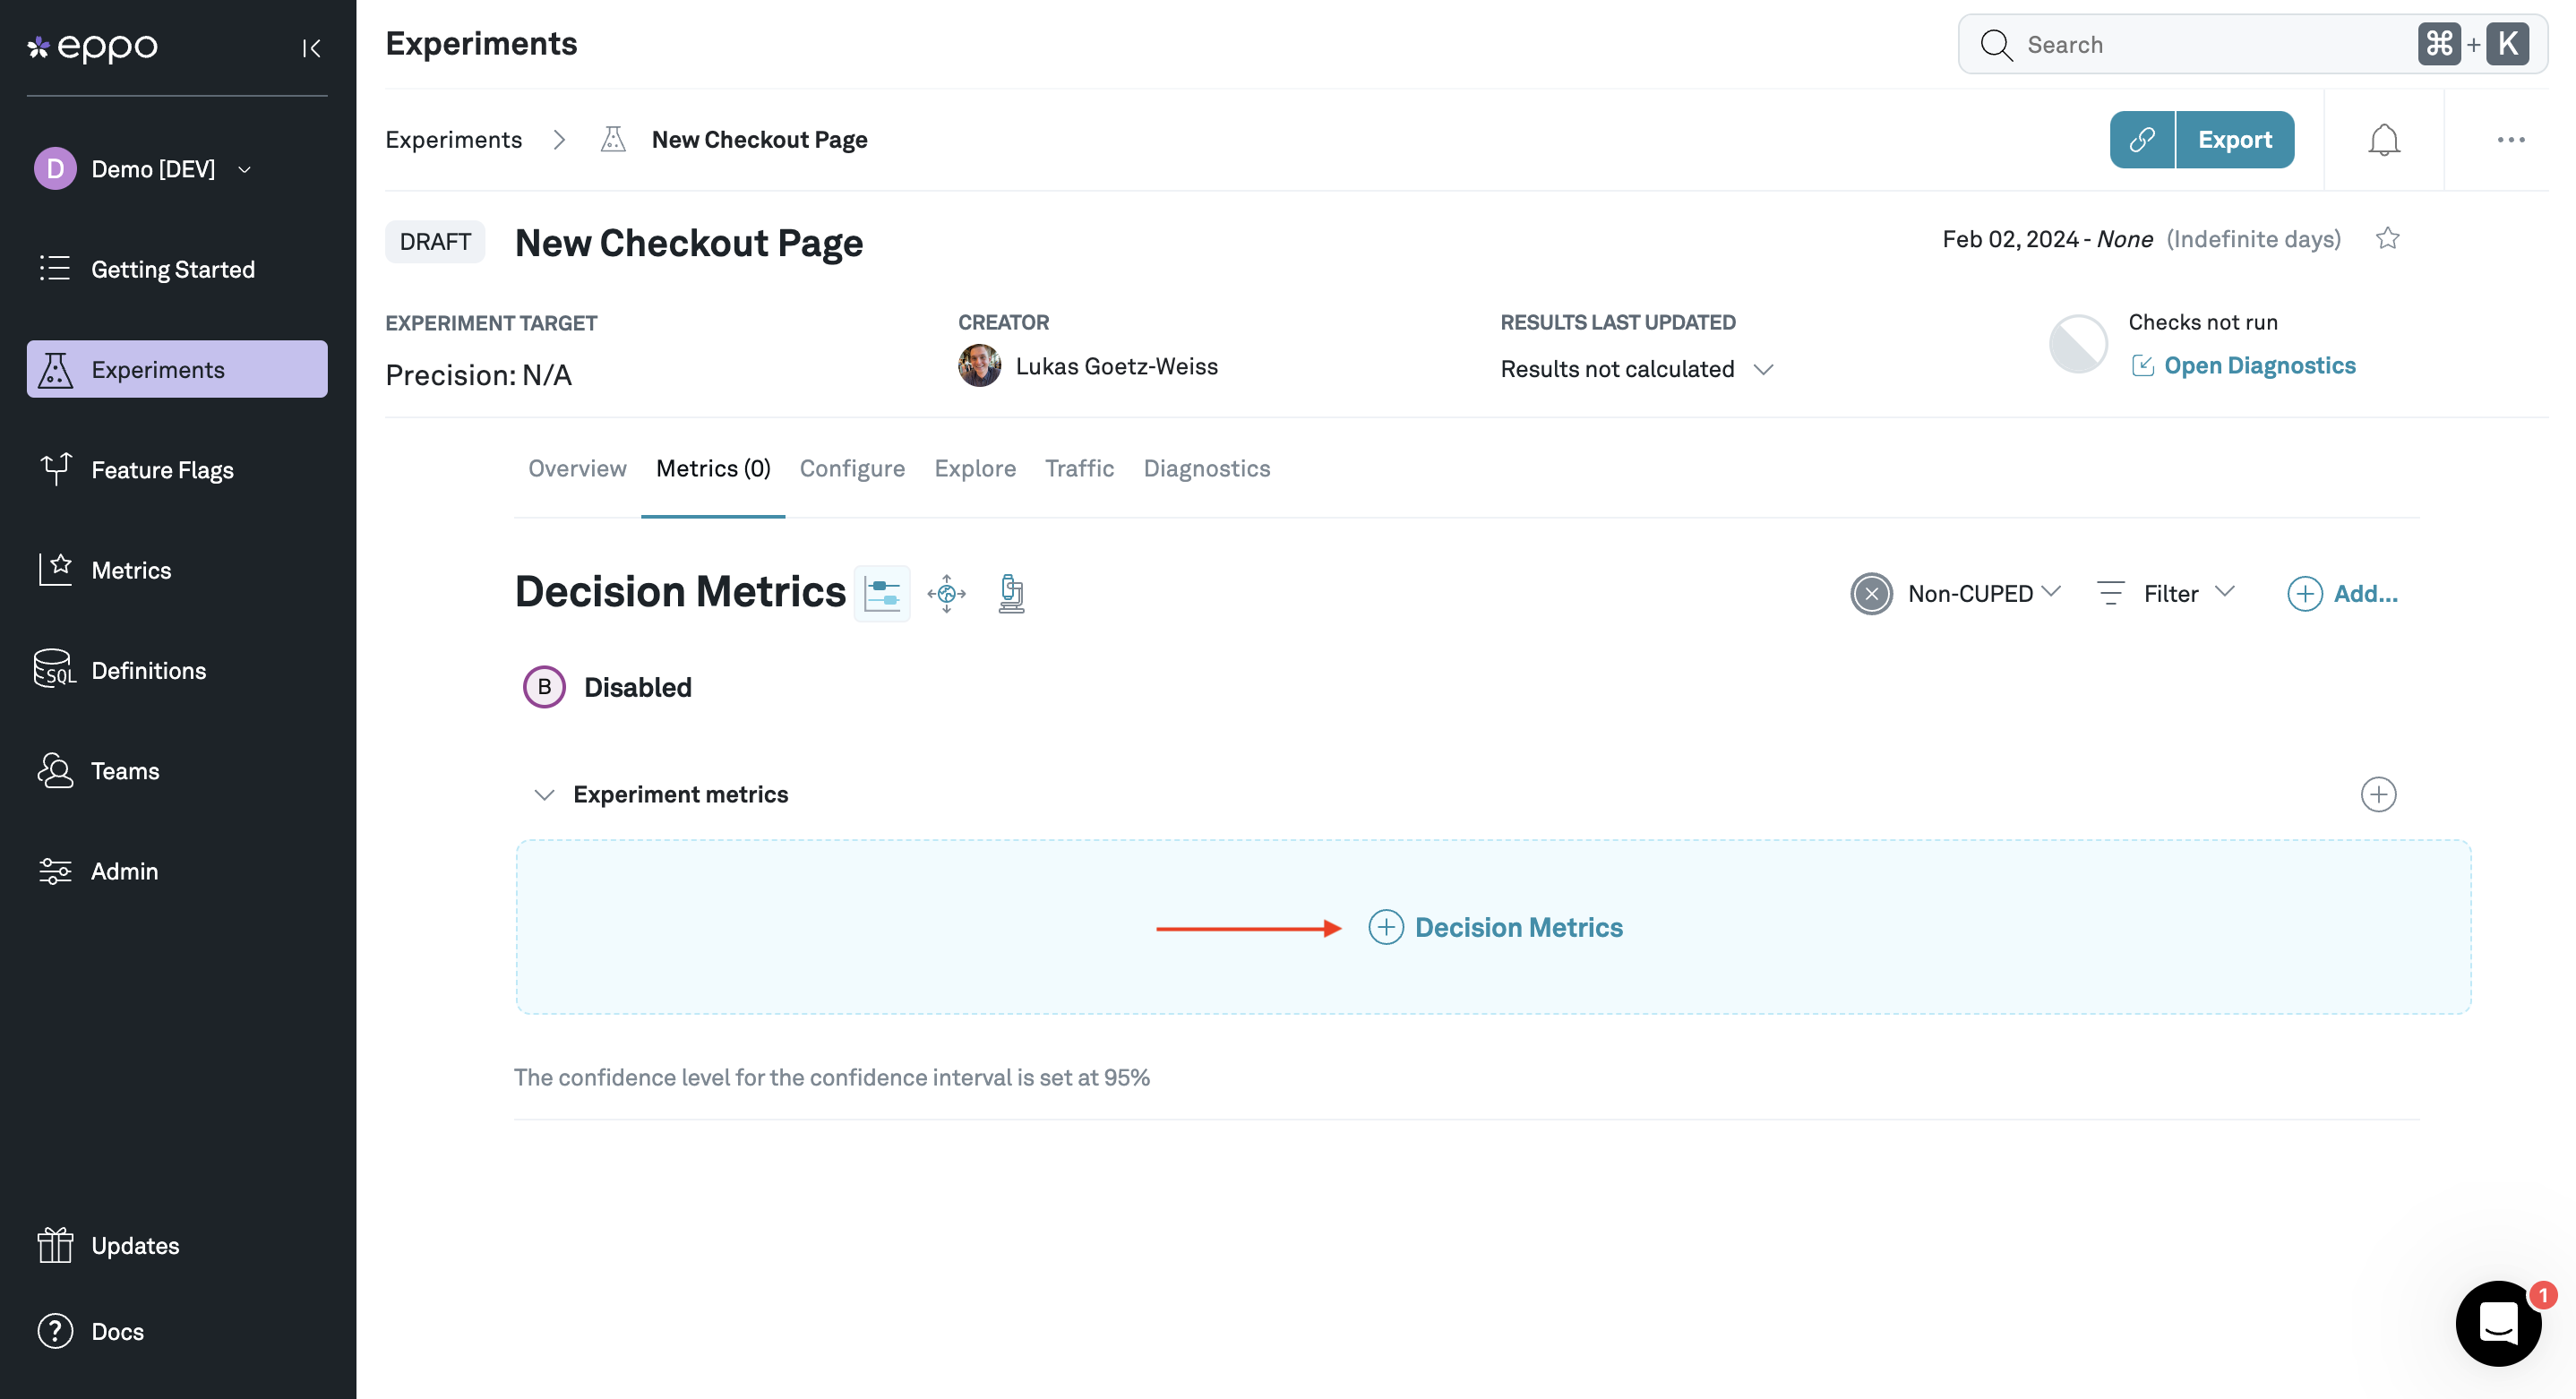
4. Add metrics
Now that the experiment is configured, navigate to the metrics tab and click +Add or +Decision Metrics. From here, you'll be able to see all of the metrics you created during the metric quick start. Select any that are relevant to this experiment.
5. Run the analysis and visualize results
By default, results will update in a nightly incremental batch job. If you want to get results immediately you can manually trigger an update by clicking update now (see screenshot).
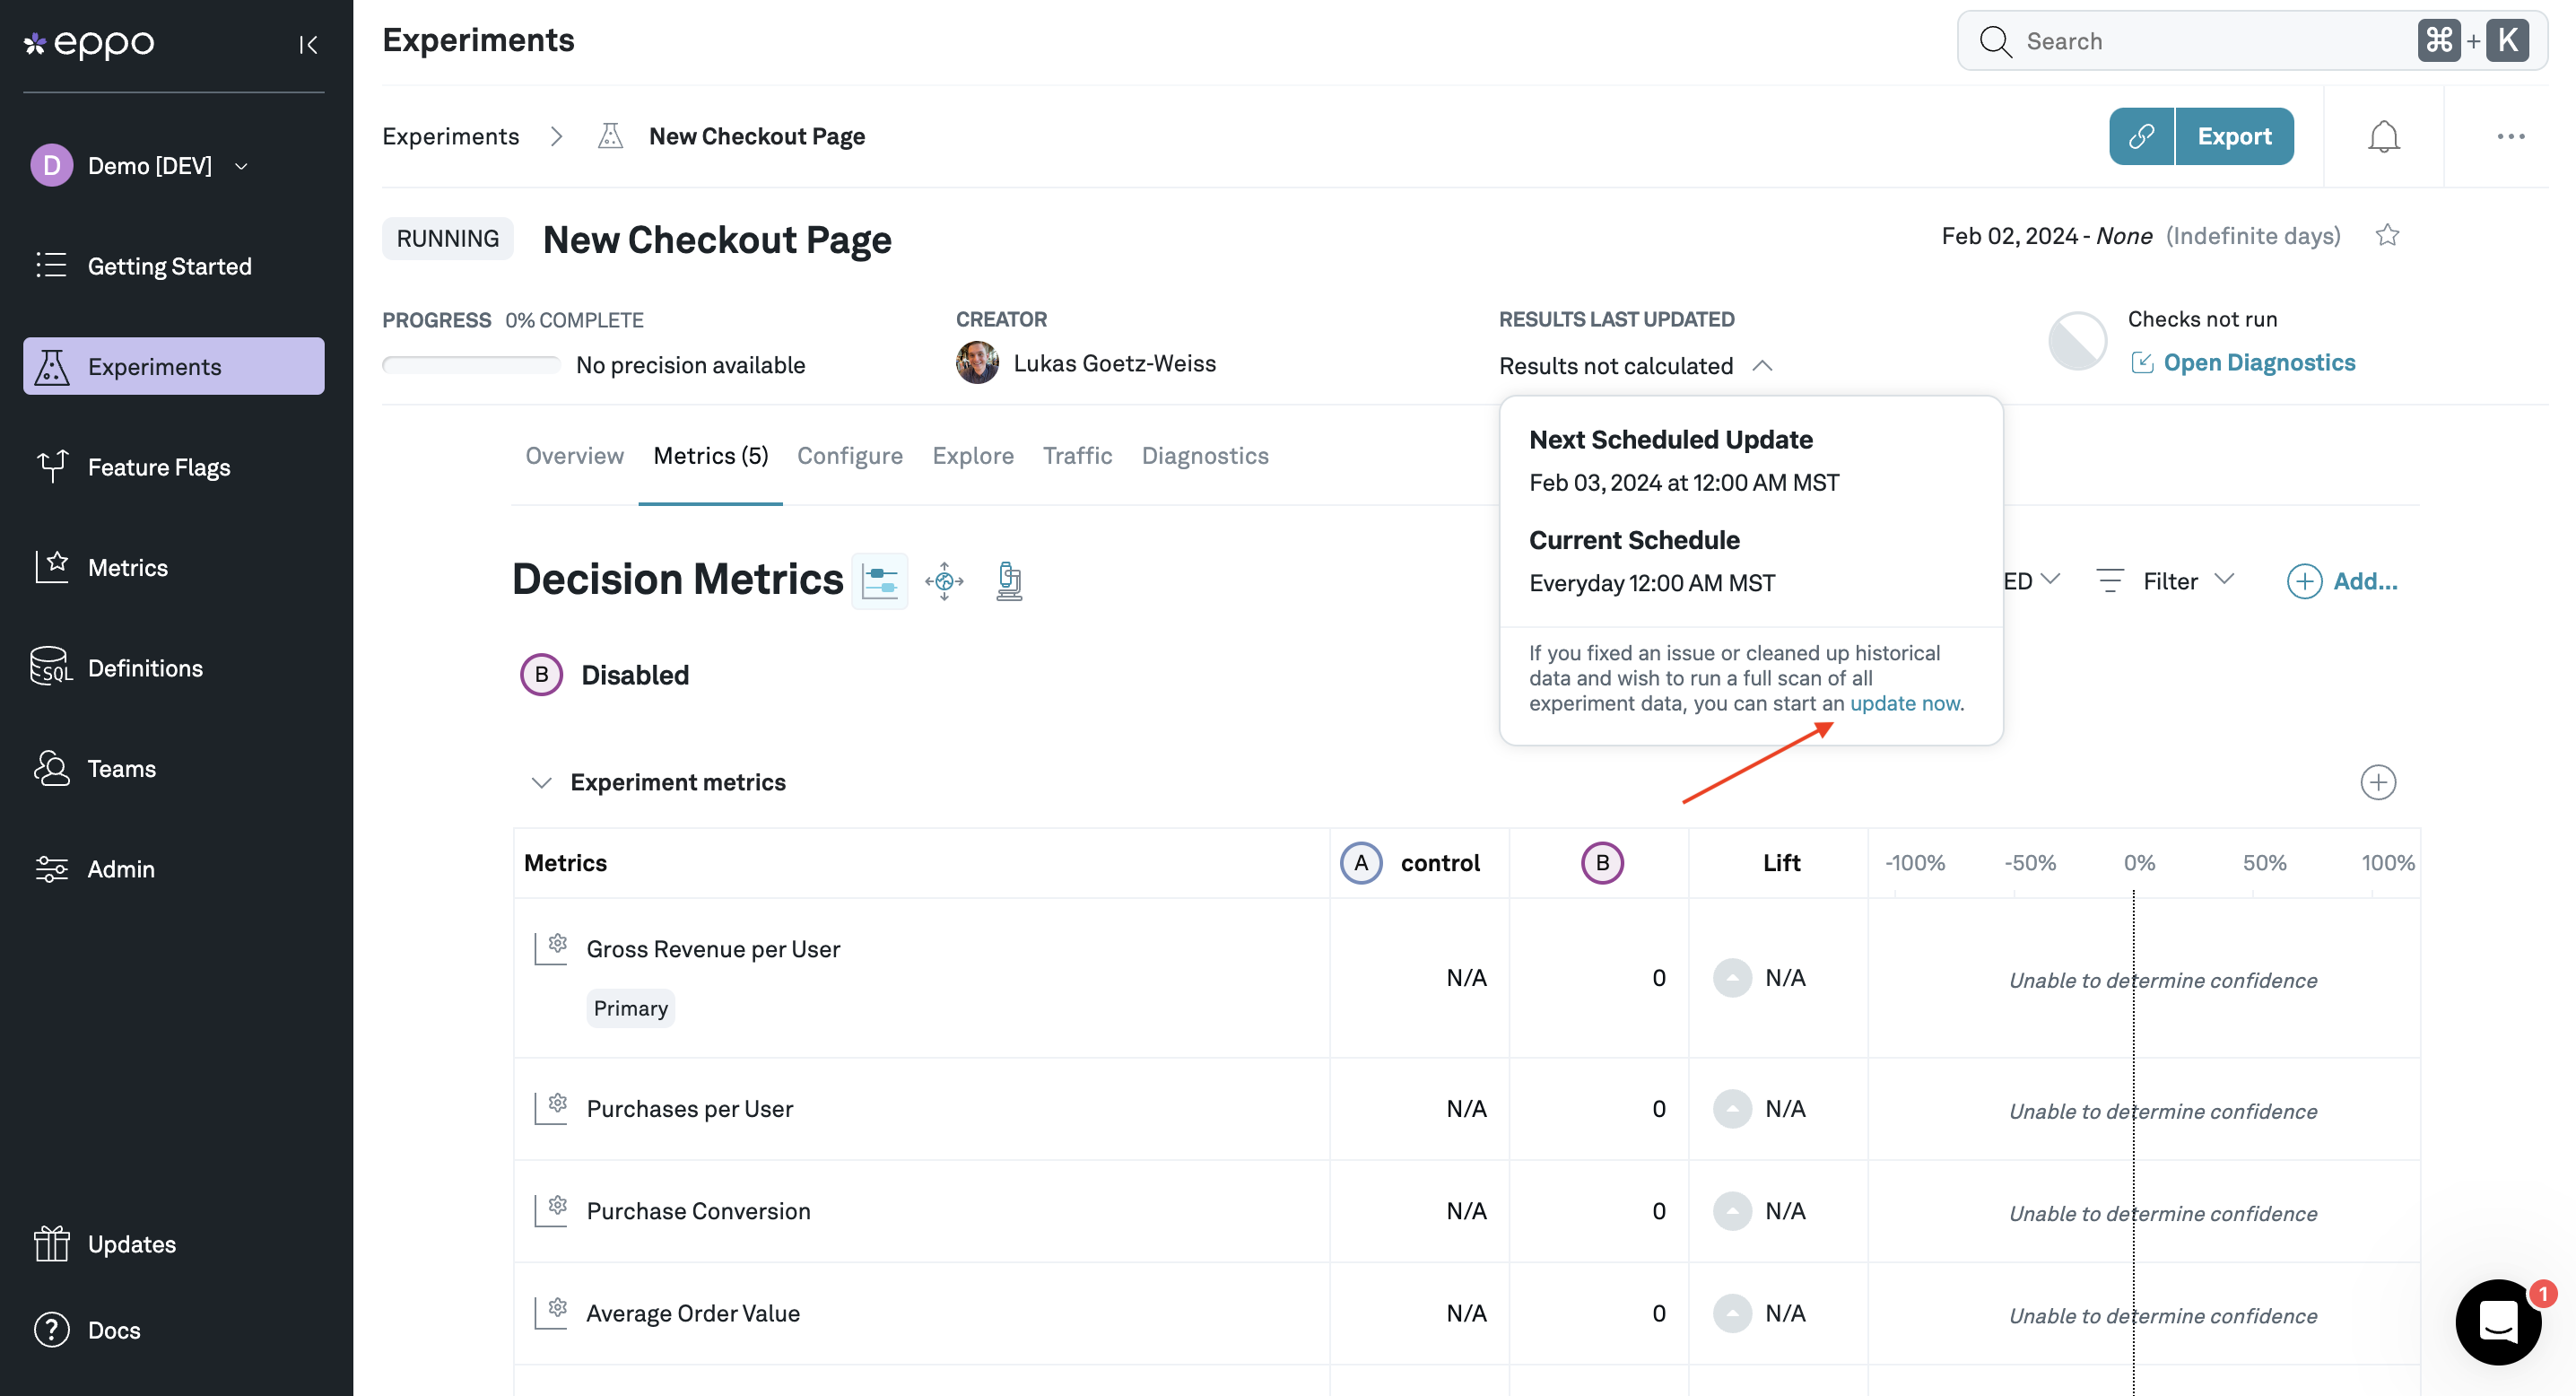
Depending on the size of your data and the warehouse resources that were provisioned for the Eppo service account, this update can take anywhere from a couple of minutes to about half an hour. The first run is typically the longest as subsequent nightly refreshed only process new data.
Once the job completes, you'll see a scorecard with each metric, measured lift, and confidence intervals.
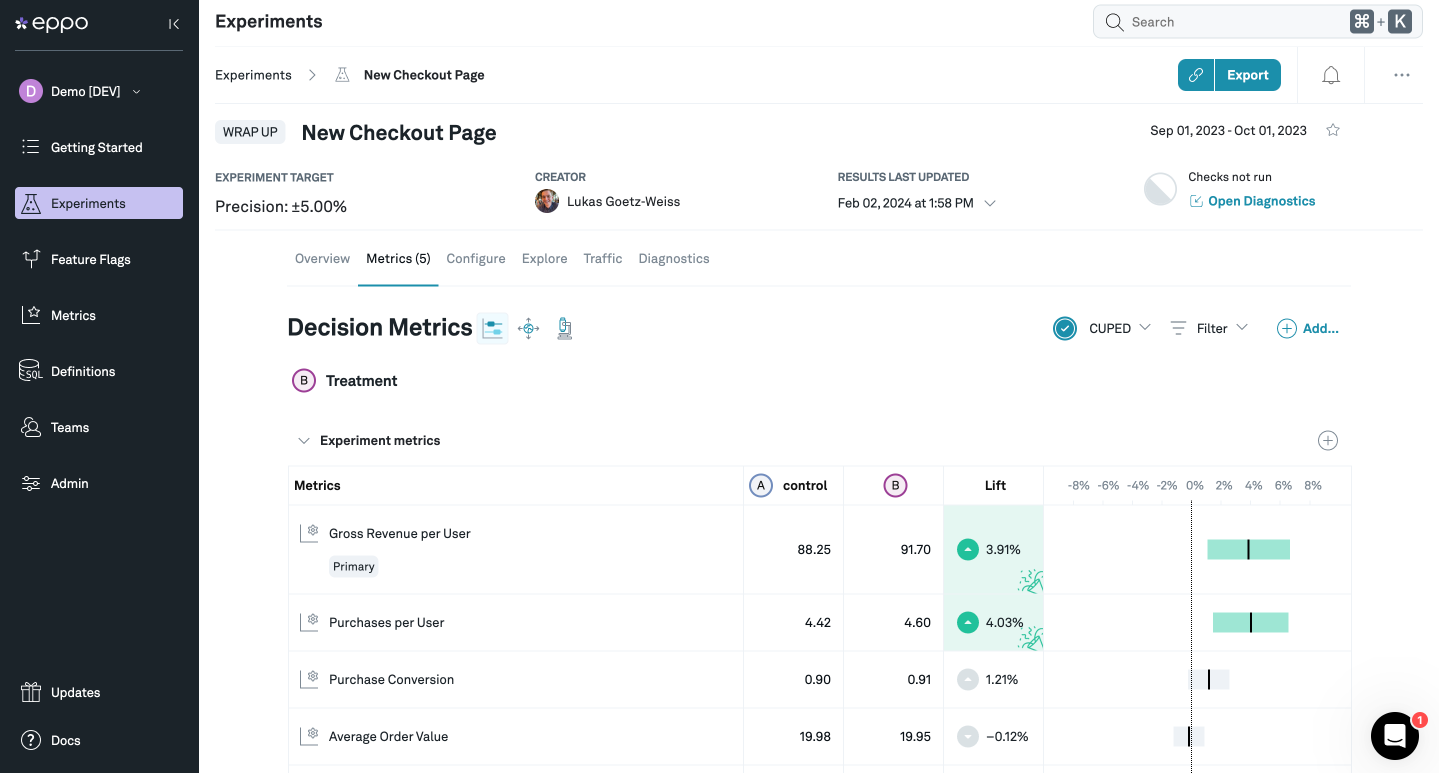
Congratulations, you have now created your first experiment analysis! If you want to analyze additional experiments, simply repeat this process but substitute in a different experiment key.
This is just the surface of Eppo's functionality. To learn more about analyzing experiments, see the Experiments section of our documentation.