Global Lift
It's common for experiments to target a specific set of users: you might test a change on an iOS app but keep the Android version the same. In such cases, it's common to ask "how will this localized experiment impact global metric values?". This is particularly useful for reporting out on experiment results. You could move iOS user's revenue by 10% but the overall impact on company-wide revenue will be smaller.
Eppo makes it easy to understand not just how your experiment is moving local metrics (e.g., iOS revenue), but also its impact on global metrics. To start, navigate to the metric page on your experiment of interest and click Impact Accounting:
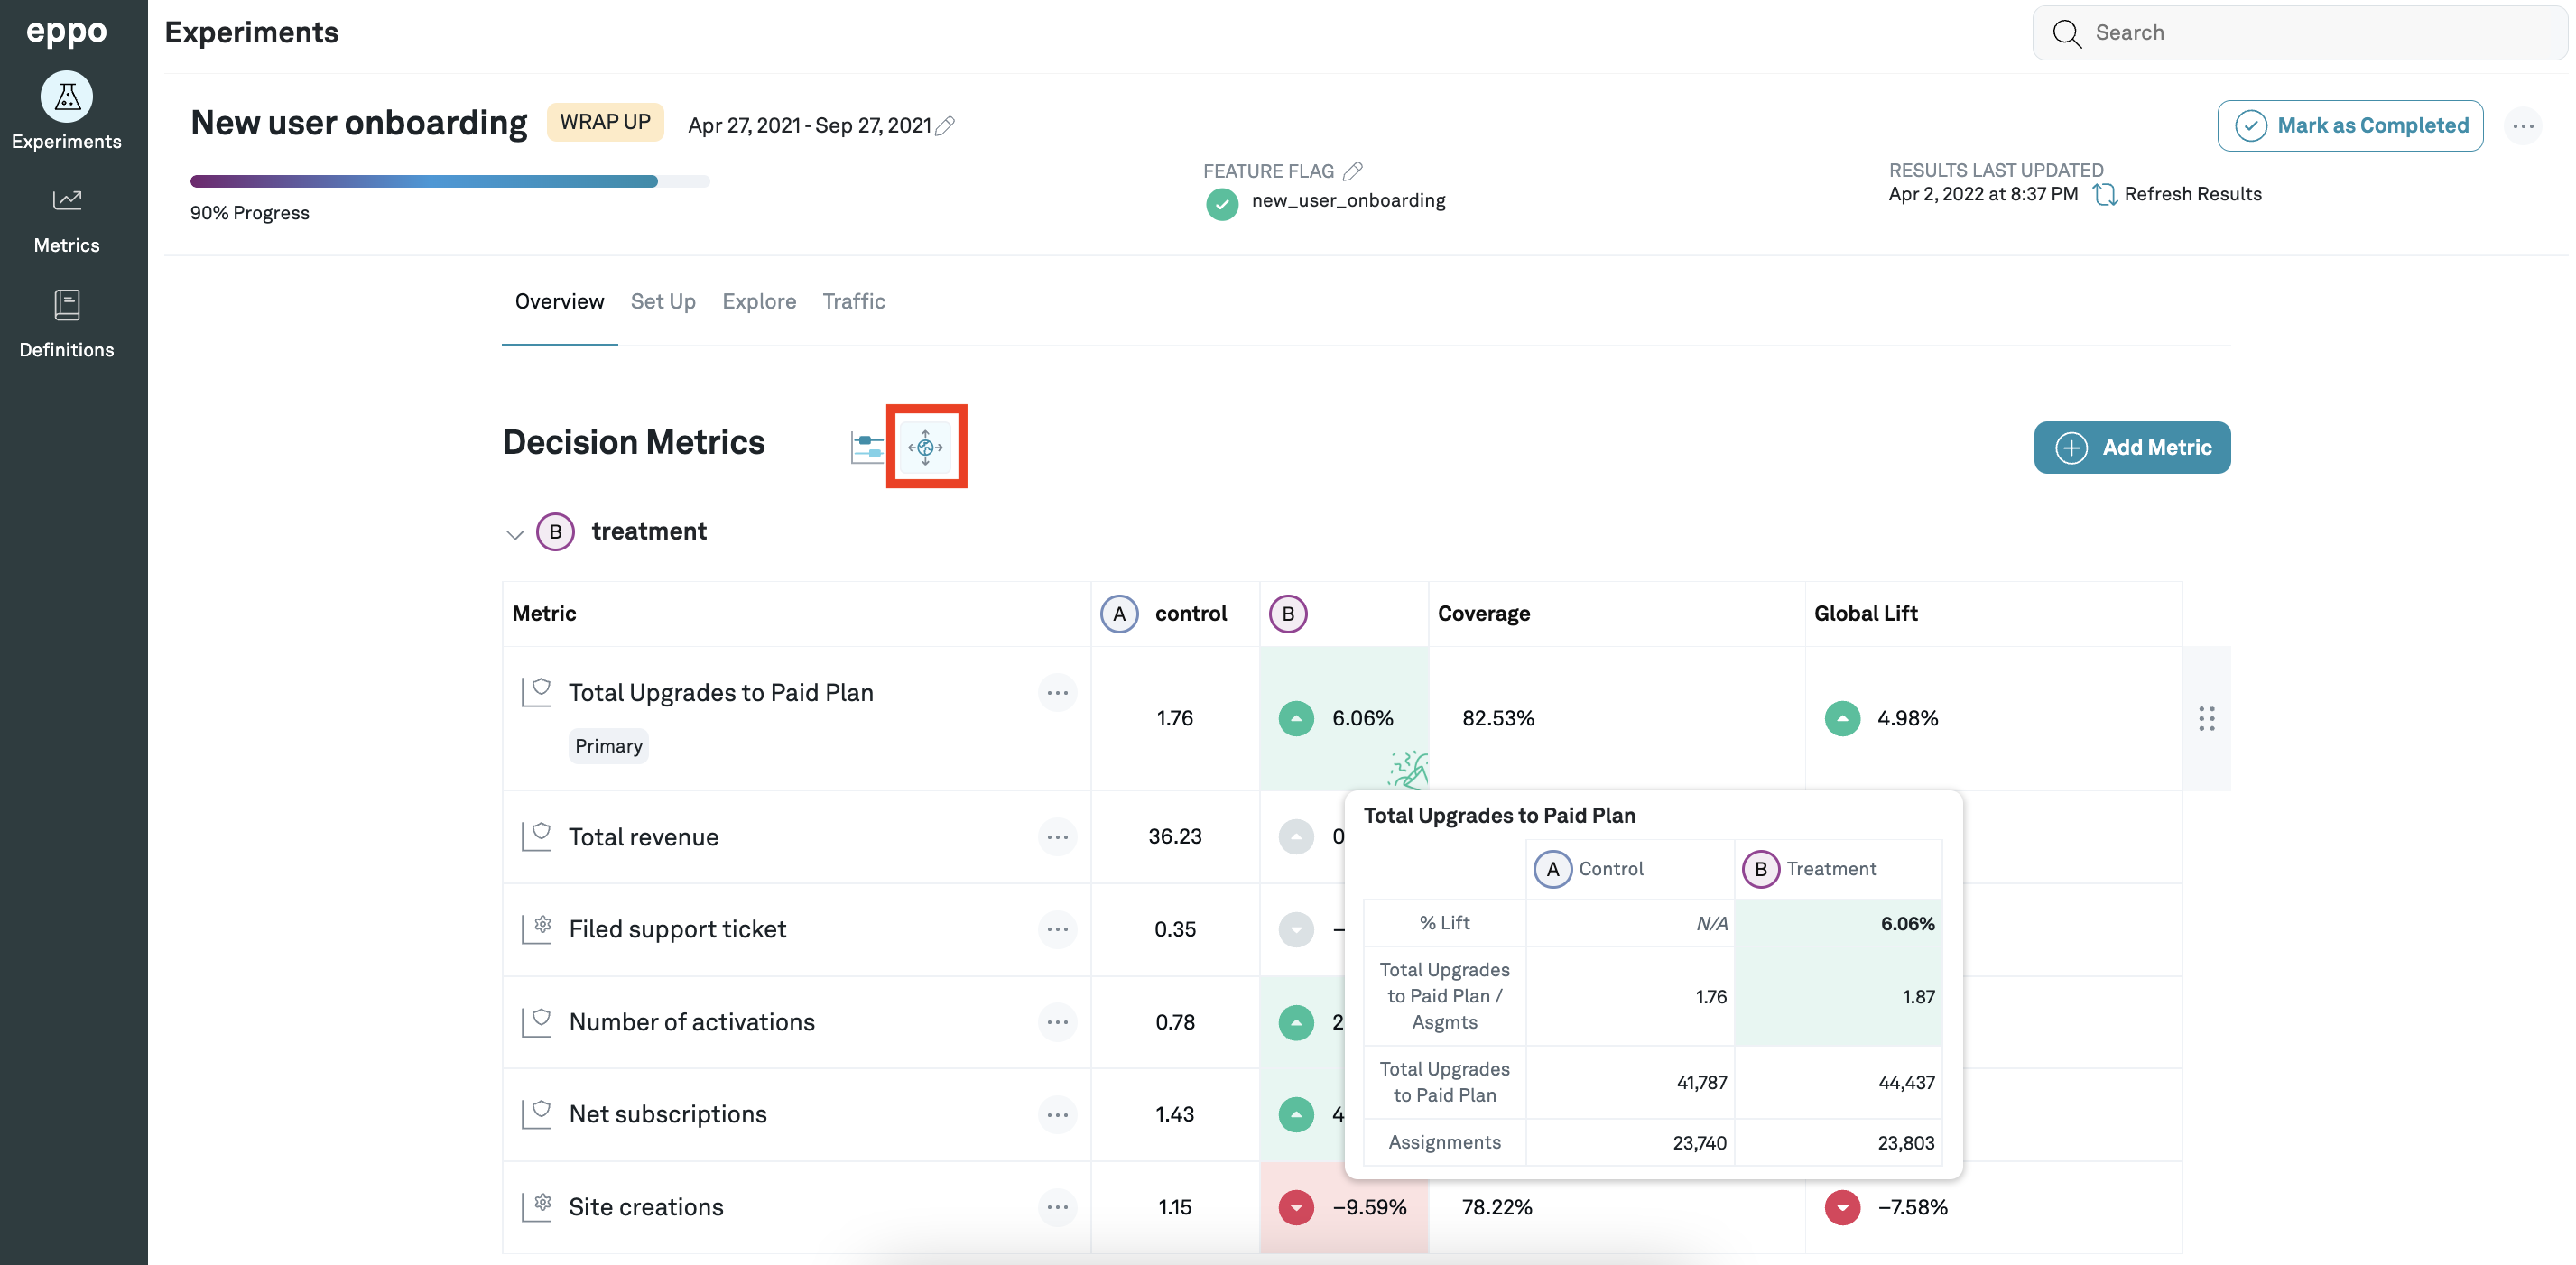
In addition to the local impact of your experiment, this page also shows the Coverage (how much of the company-wide metric total is captured by this experiment's population), and the Global Lift (the expected impact your experiment will have if rolled out to the global audience).
Global Impact assumes you roll out the new variant to all eligible subjects. If an experiment is targeted towards iOS users, it's assumed that you will only roll out the treatment to iOS users. We do not estimate what an impact would be for other users (presumably there would be another experiment to validate the change for Android).
If your rollout plan would include additional users from the same audience that were not flagged as part of this experiment (for instance, because there was a mutually exclusive experiment being ran on iOS users at the same time), you should update the Traffic Exposure setting in the experiment configuration.
Global lift and coverage are currently only available for sum and count aggregation types. For details on how Global Lift is calculated, see the Statistics section.