Experiment Forecast and Roadmap Planning
As a Product Manager or Lead for a Growth team, every quarter you’re given a goal and you’re responsible for producing a roadmap that meets that target. You and your team put your best ideas together, and you have some confidence because they’re good ideas founded upon user research, but you still don’t really know if you’ll quantitatively hit your number.
Eppo's Experiment Forecast tools is designed to give you clarity, control, and confidence in forecasting the impact you'll make as you put together your roadmap.
Experiment timeline
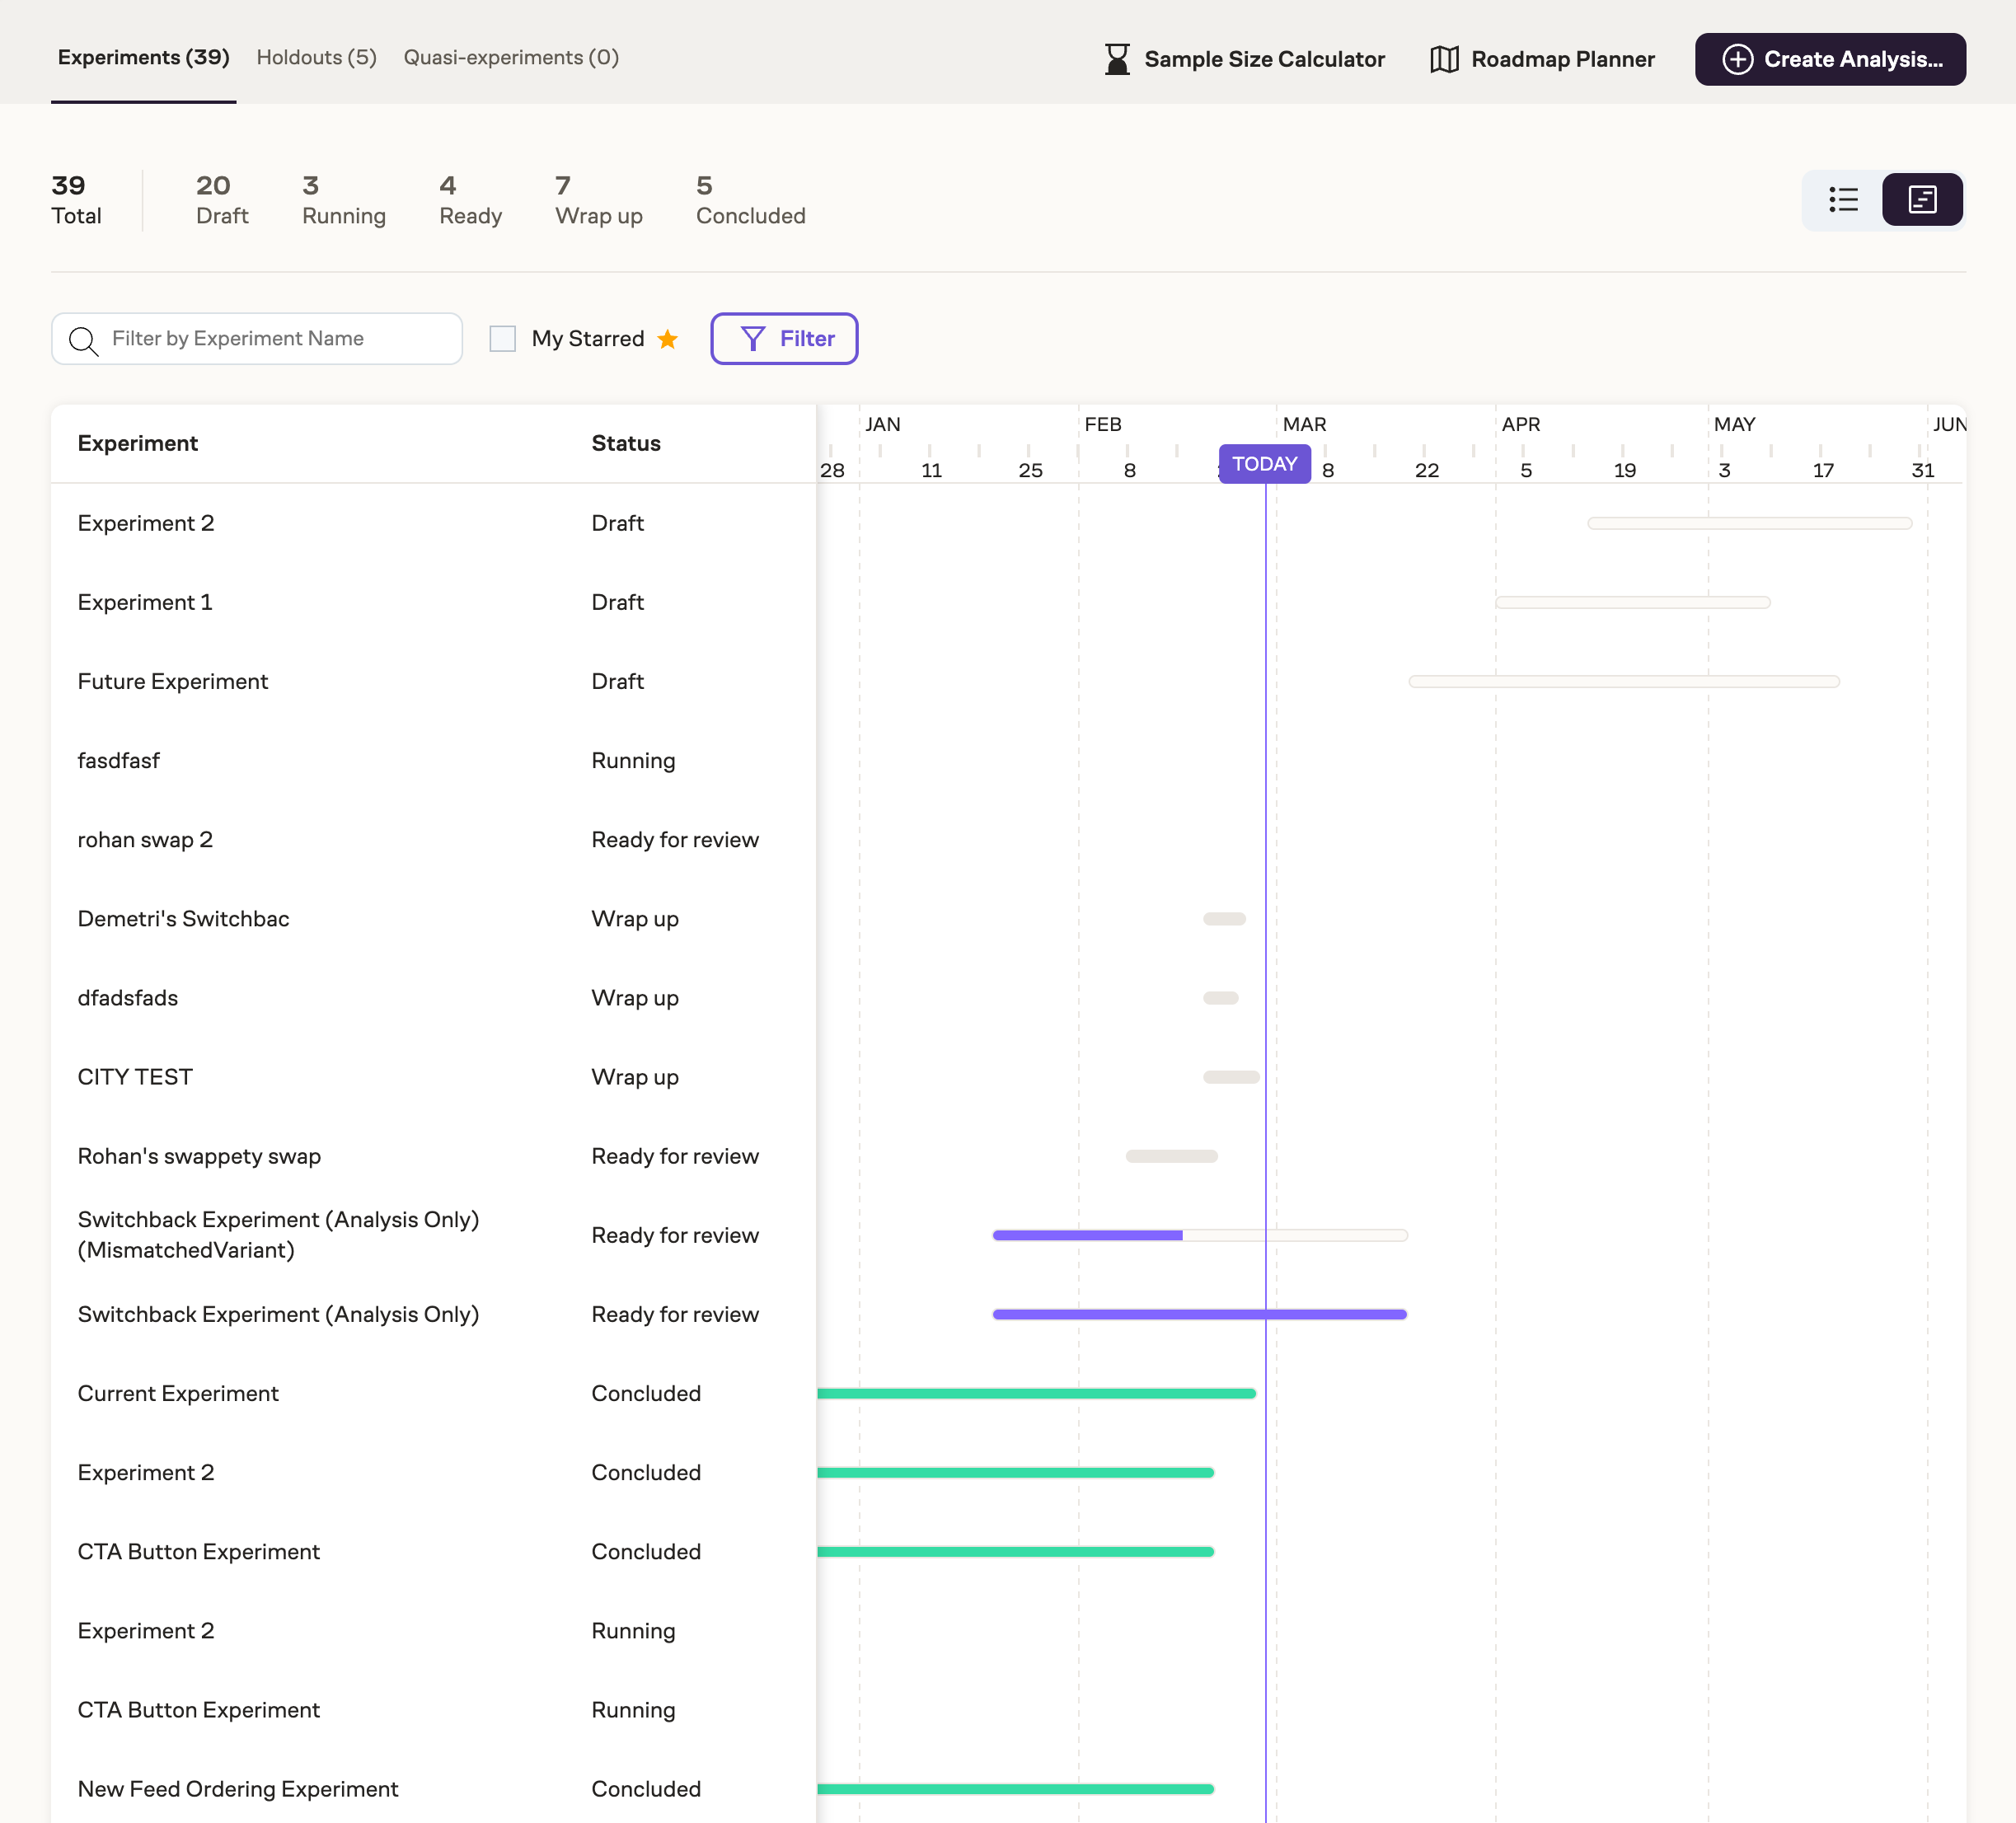
The Experiment timeline view is a visual representation of experiments run and their outcomes over time. You can switch between a list of experiment to a timeline view by clicking the Timeline button in the top right corner of the experiment page.
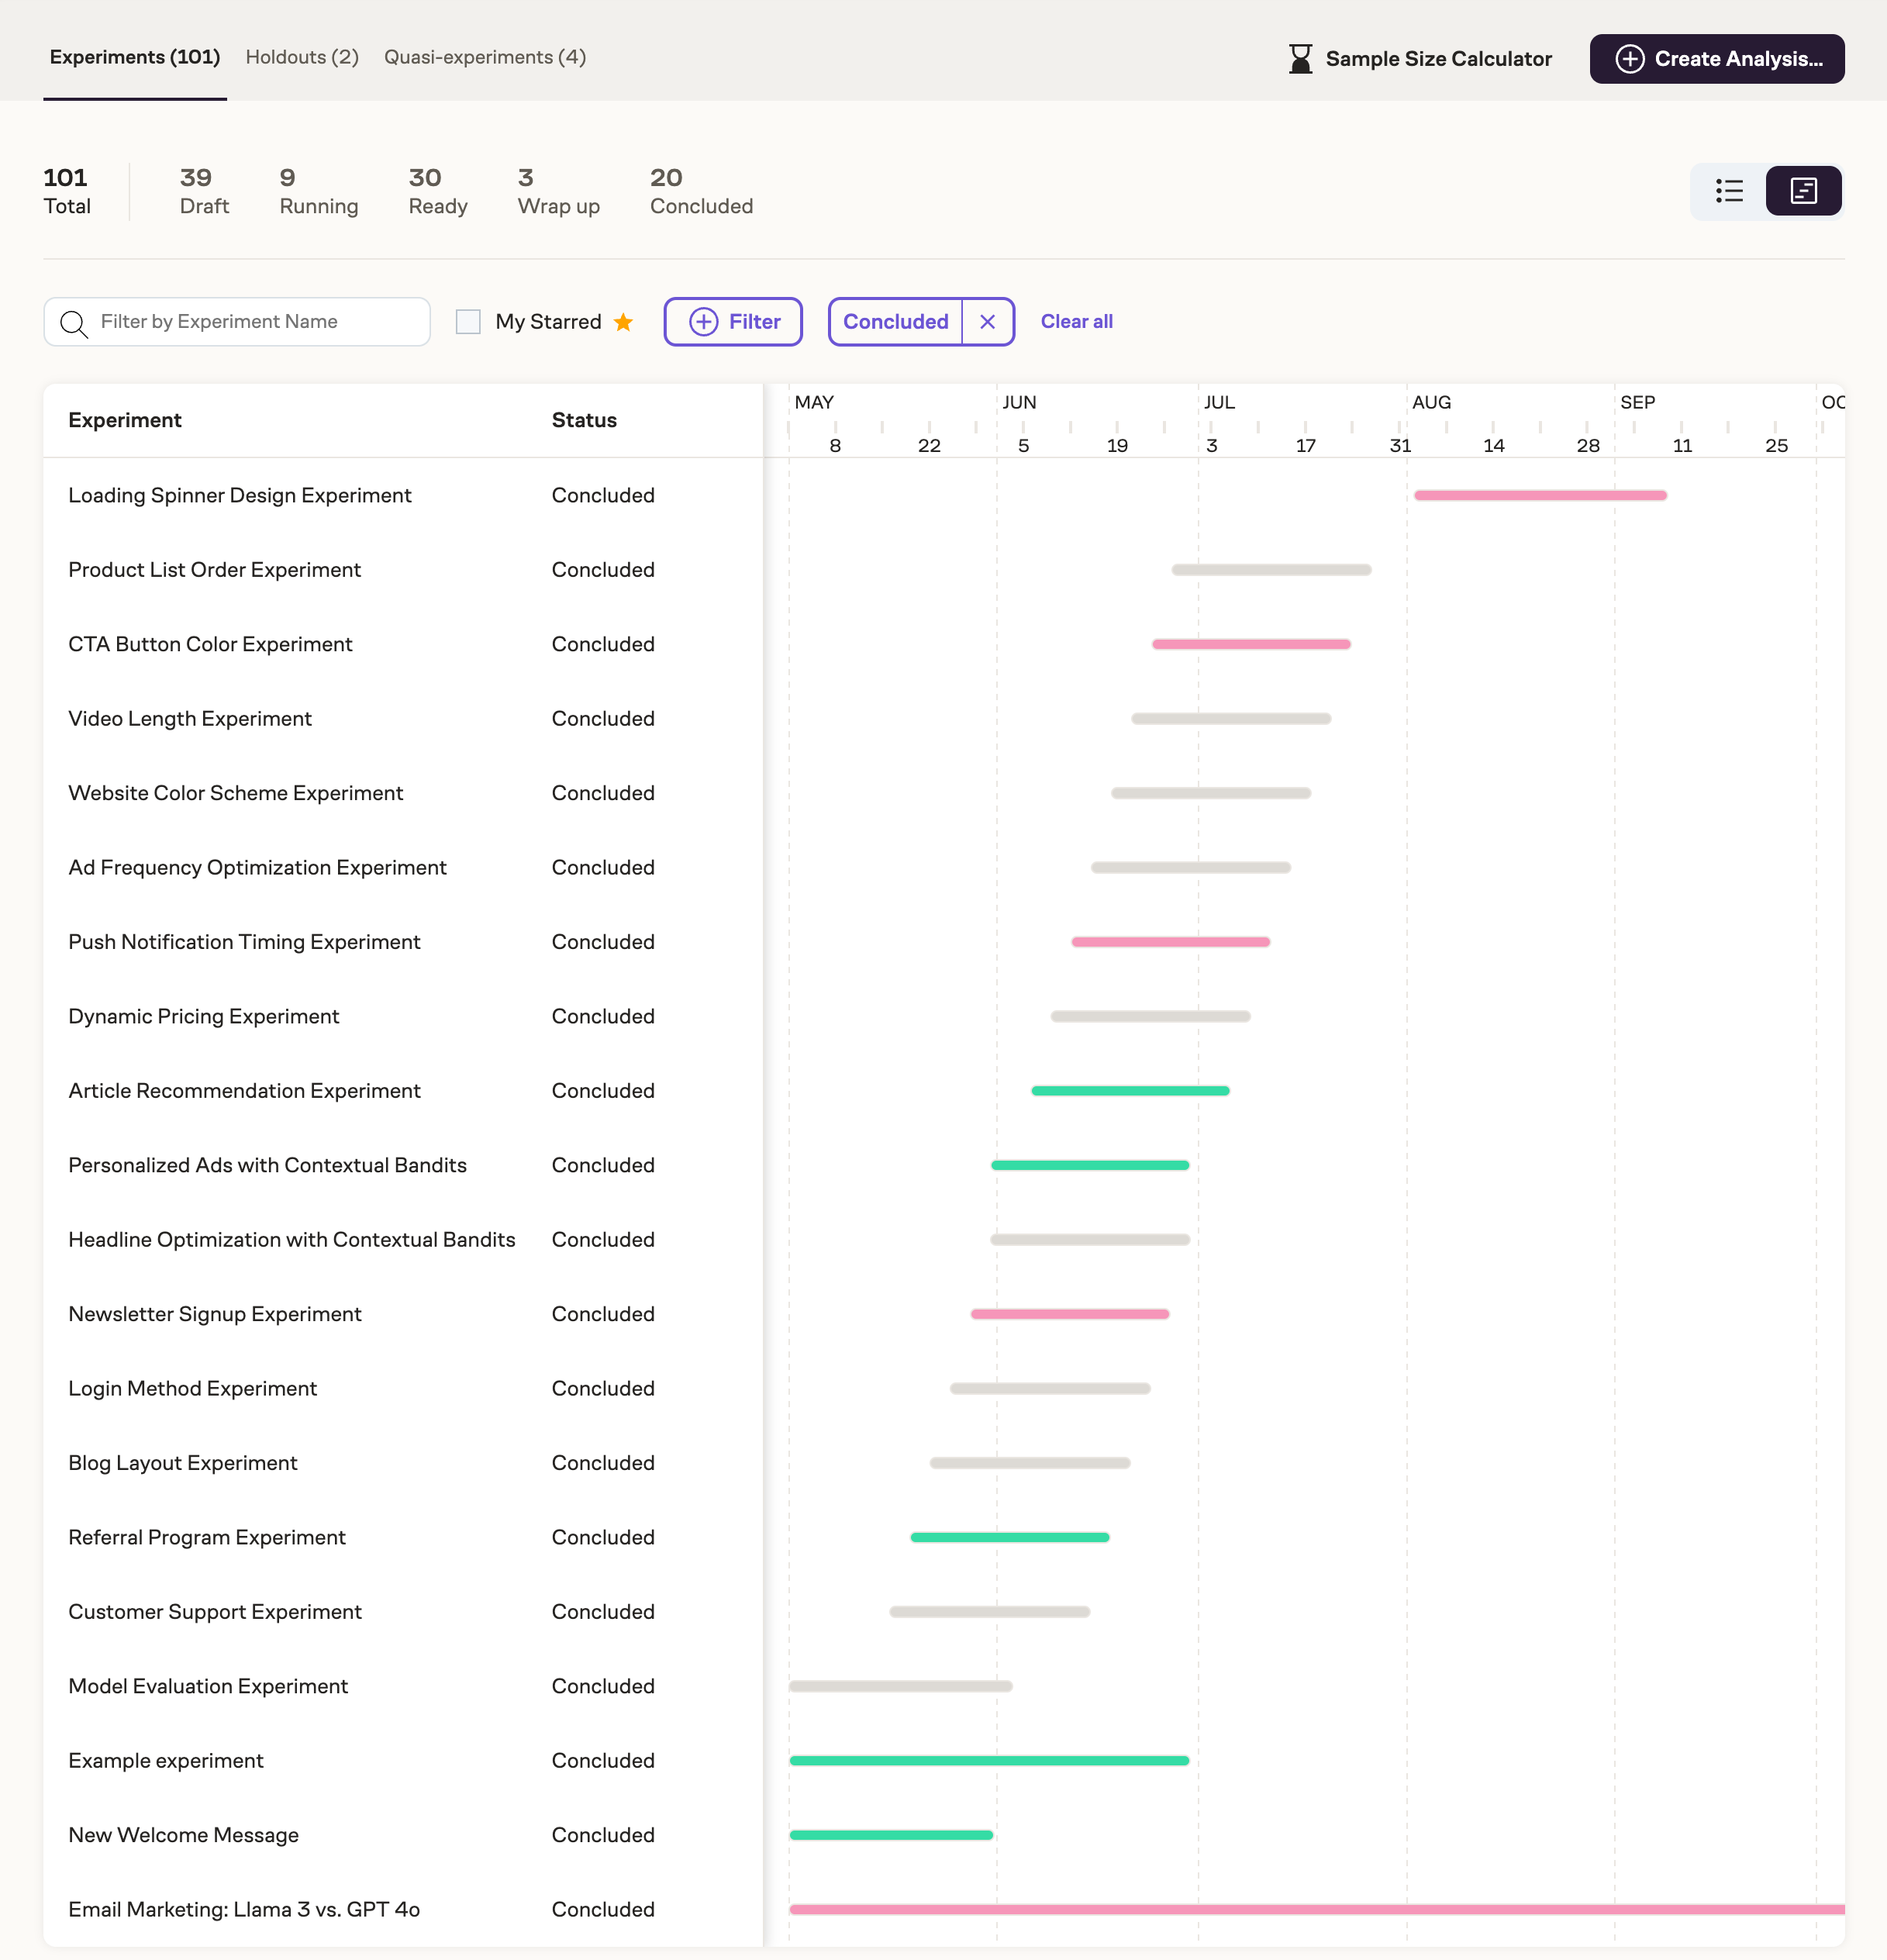
By default, the timeline will show all experiments sorted by start date descending. You can also filter the timeline by experiment name, timeframe, status, entity, team, creator, primary metric, or just show experiments you have starred.
Experiments in the timeline are color coded by their status and outcome:
- Running, Ready for Review and Wrap Up - Grey with purple bar indicating progress towards goal
- Completed with positive result - Green
- Completed with neutral result - Grey
- Completed with negative result - Red
Roadmap Planner
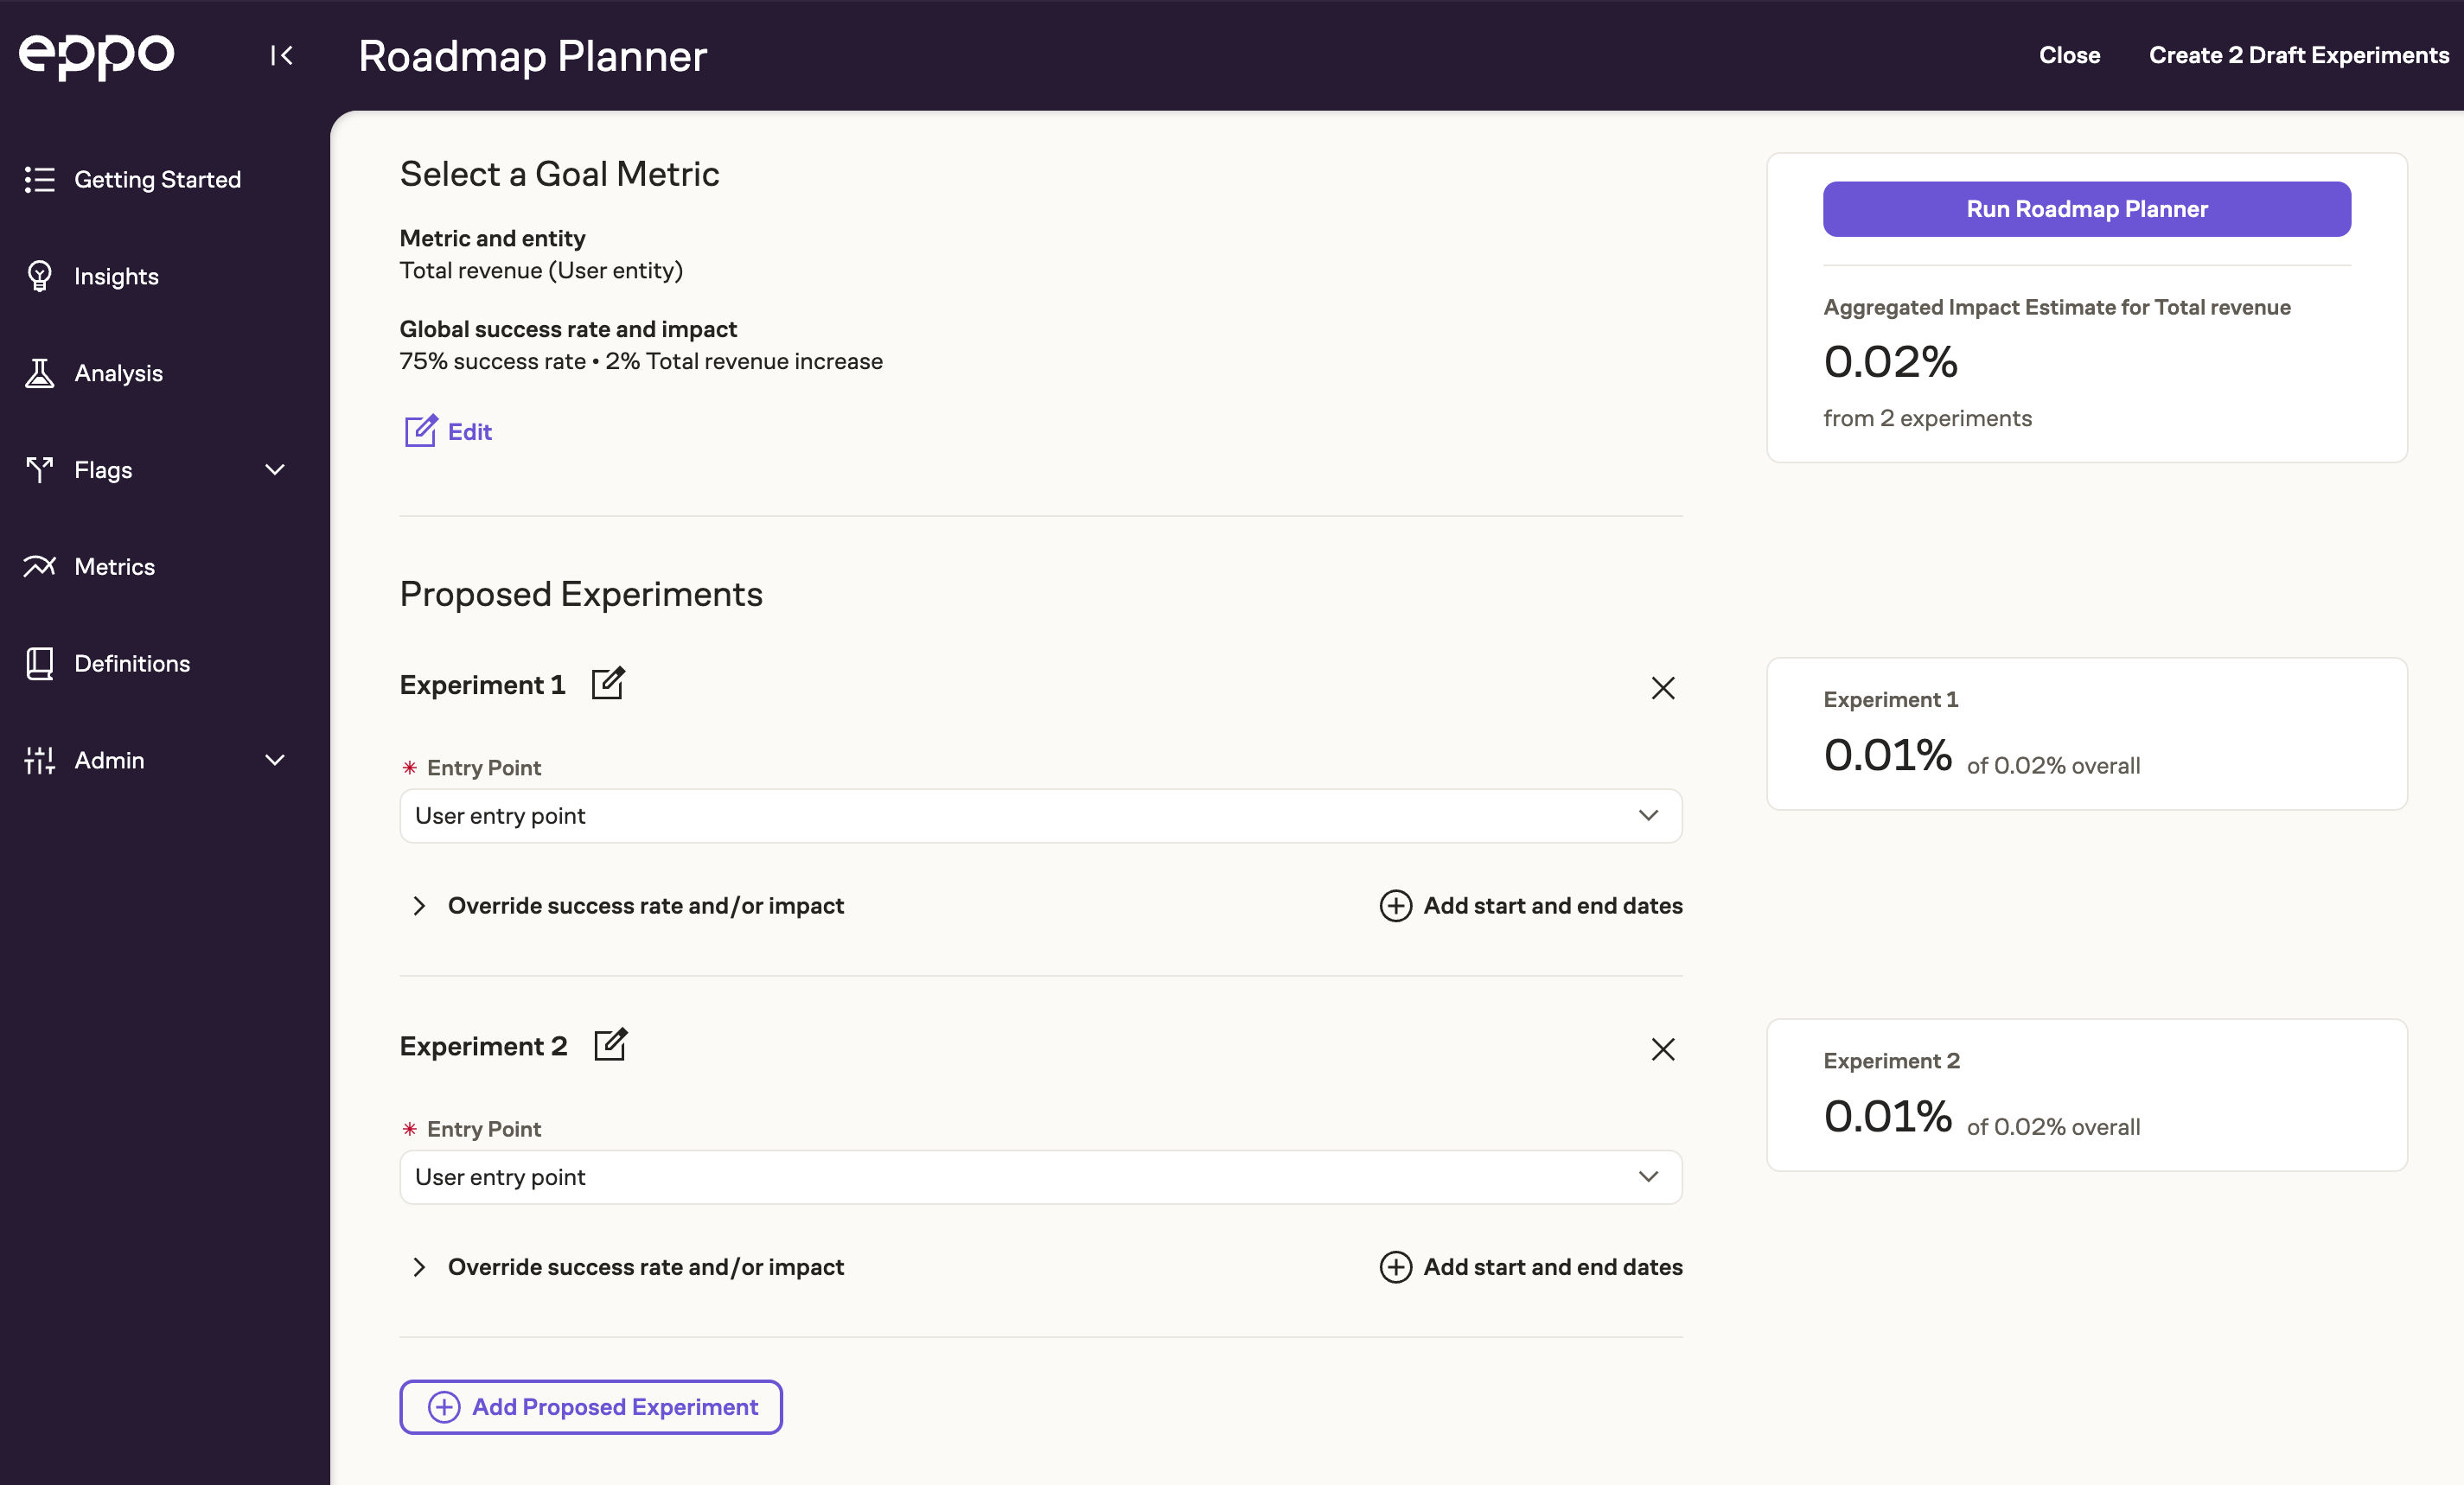
The roadmap planner helps you iterate on different scenarios quickly to find a plan that can realistically hit your targets. By using historical data to inform your assumptions, you can make data-driven decisions about which experiments to prioritize and how many experiments you need to run to achieve your goals.
Here's how to use it:
-
Navigate to the Analysis page and click on "Roadmap Planner" in the left sidebar. This shows any previously saved calculations. Click "Start roadmap plan" to get started.
-
Select the entity and metric you want to forecast impact for
-
Configure your baseline assumptions:
- Success rate: The percentage of experiments you expect to be winners. If you've run at least 10 experiments in the last three months, Eppo will provide your past success rate.
- Average impact: The typical lift you see from successful experiments
-
Add your planned experiments:
- Click "Add experiment" for each planned experiment
- Provide an entry point for each experiment. Impact forecasts change based on where your experiment manifests in your product.
- Optionally:
- Add a new for the experiment
- Set start and end dates
- Override the default success rate and impact if you have different expectations for specific experiments
-
Click "Run roadmap planner" to calculate the estimated cumulative impact of your planned experiments. This may take up to a few minutes. You can navigate away from the page as Eppo calculates this in the background.
-
Review the forecast:
- See the estimated impact range
- Adjust your plan if needed by adding/removing experiments or modifying assumptions
-
When satisfied with your plan:
- Click "Add to roadmap" to create draft experiments
- The experiments will appear in your experiment timeline and list marked as "Draft"
- You can then build out the full experiment details when ready
When used in conjunction with the Experiment timeline view, you'll have a roadmap ready to go with confidence in the impact you will make.