Performance Scorecard
The Performance Scorecard provides an aggregate view of the experimentation program. It can be used to communicate program impact, promote teams experimenting with high velocity, and identify teams that need assistance due to low win rates or quality.
The Performance Scorecard does this through a number of modules:
- Top Experiments
- Velocity
- Quality
- Win Rate
Top Experiments
The Top Experiments module shows experiments and the associated impact based on the metric selected.
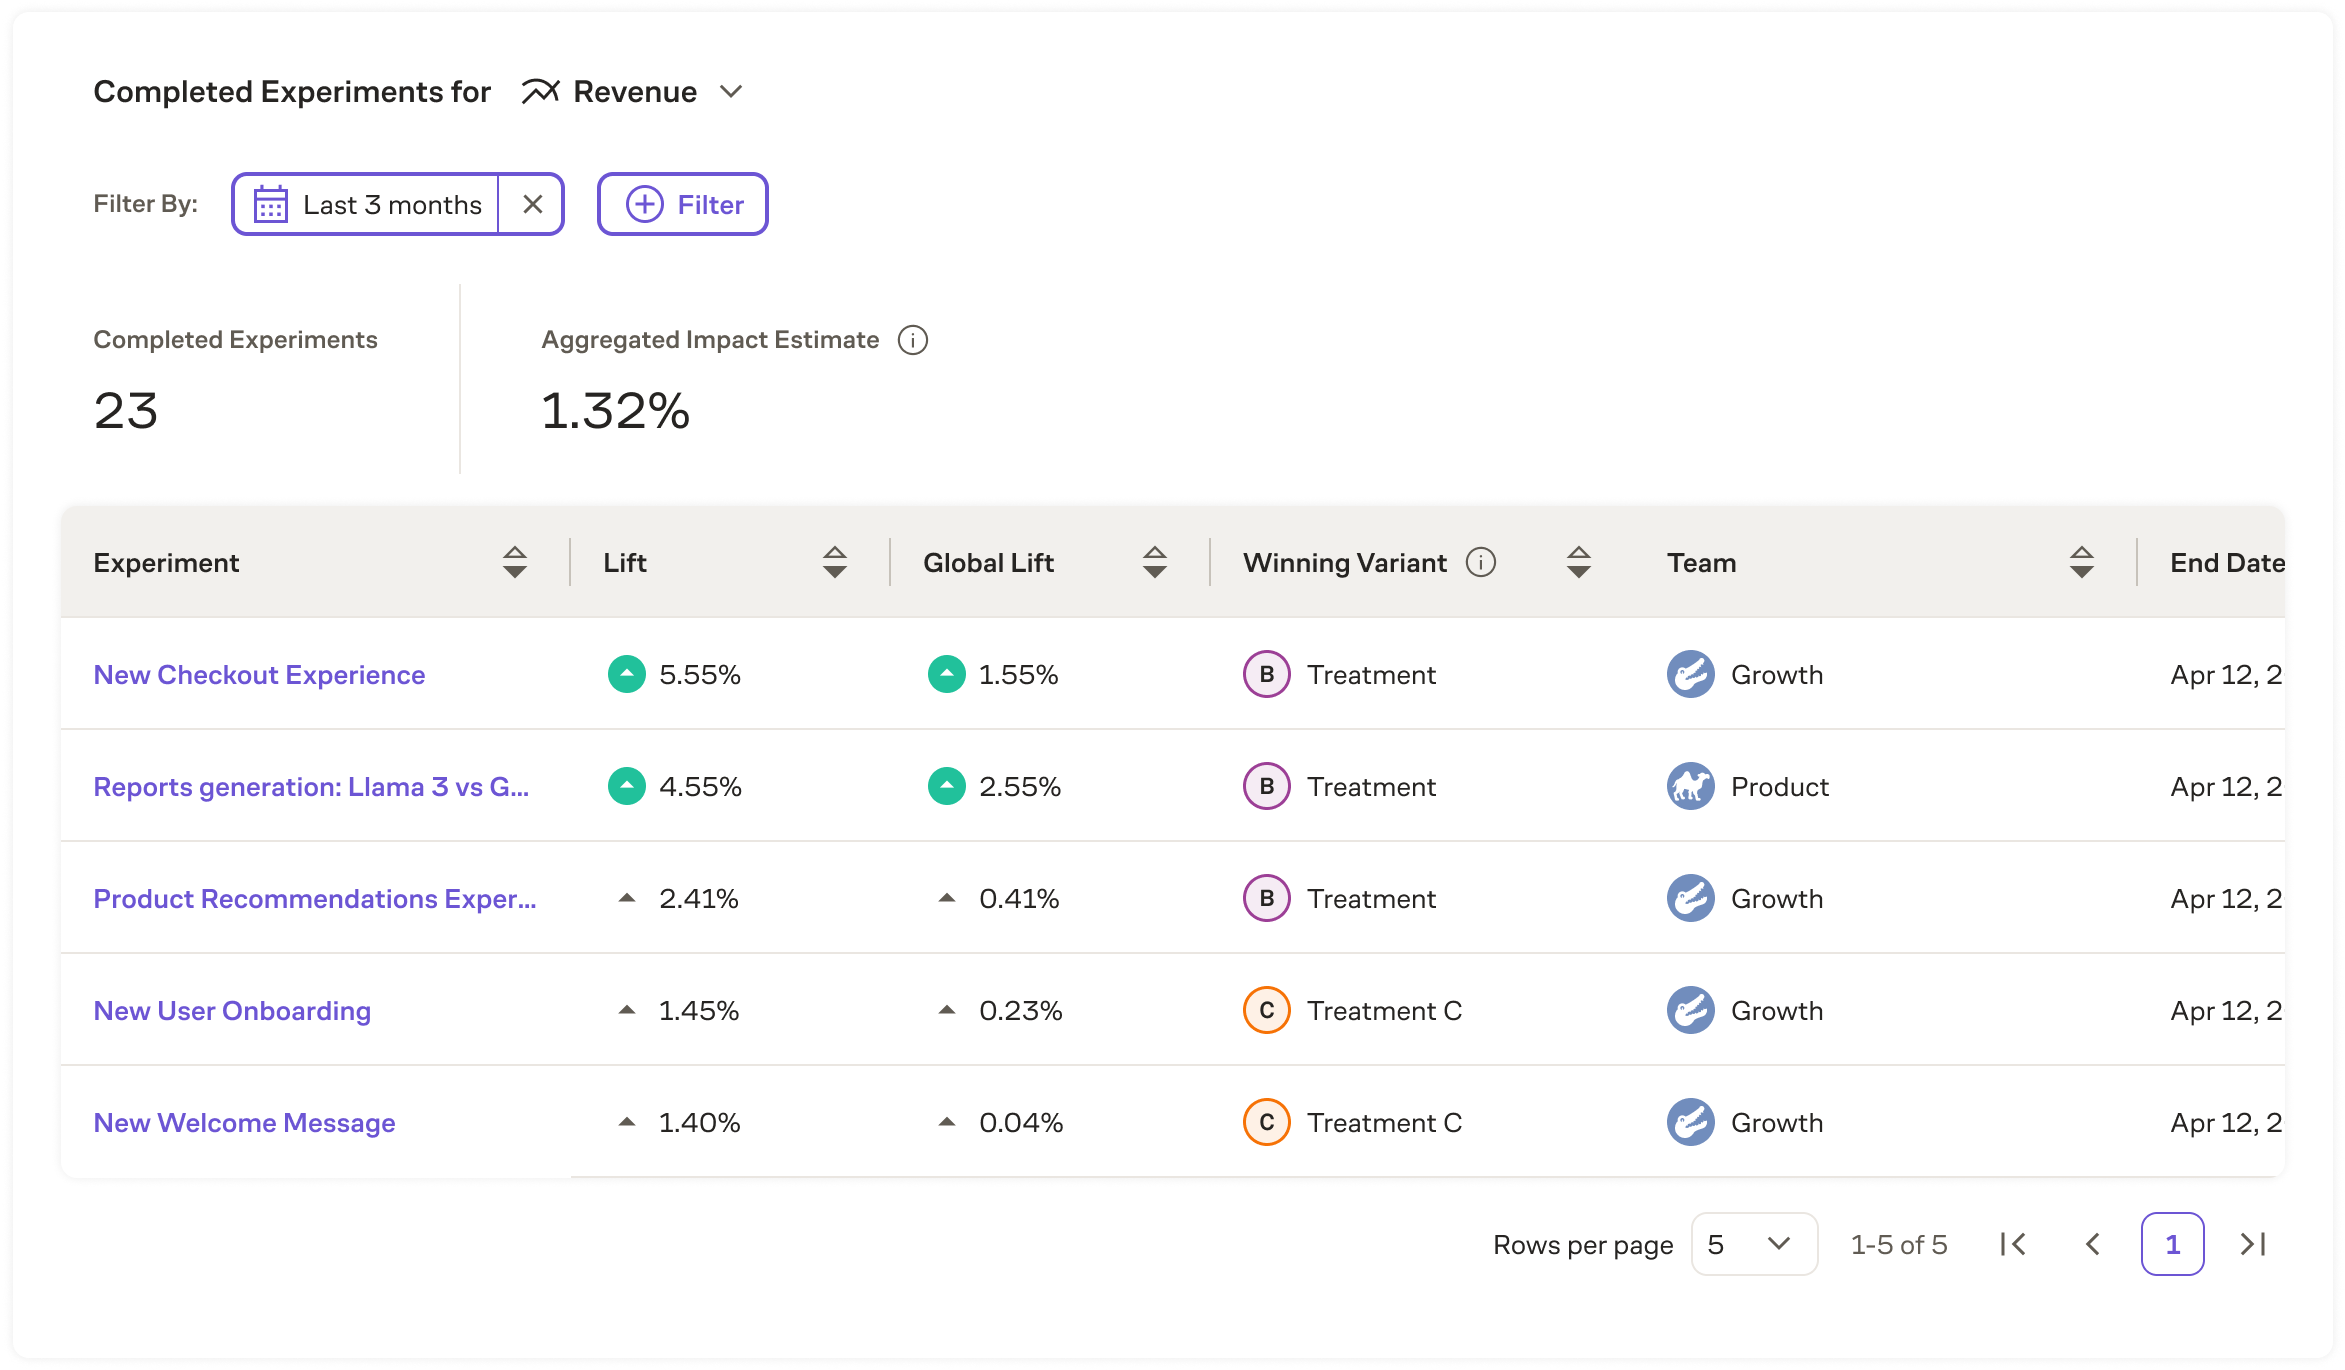
Experiments shown in this module are either in a Concluded state or have an experiment end date in the past. Concluded experiments will show the impact to the metric based on the variant that was shipped. If the experiment has not been concluded, the variant selected will be based on which one has the largest lift for the primary metric.
Experiments can be filtered in this list based on a number of criteria:
- Timeframe
- Team owner
- Creator
- Entity
Experiments are sorted by default based on their lift, but can also be sorted based on name, global lift, team, and end date.
Bayesian Aggregate Impact Estimation
The gold standard for reporting aggregate impact are Holdouts, but it may not always be feasible to run them. Bayesian Aggregate Impact Estimation is meant to provide a supplemental aggregate impact number in this case.
To measure aggregate impact, one could add up all global lifts for rolled out experiments. However, this has several issues:
- Winner’s curse: the lifts of winning variants are exaggerated because there was some factor of luck involved in a variant being a winner (a small amount for a well-powered experiment, and a large amount for an underpowered experiment).
- Interaction effects between experiments: the effects of two winning variants across two experiments might cancel each other out (or at least not be additive) when combined.
With Bayesian Aggregate Impact Estimation, Eppo is using our existing Bayesian framework to compute the lift point estimates, convert that to global lift estimates, and multiply these across rolled out variants. Because Bayesian point estimates automatically get shrunk to 0, and more so for underpowered experiments, this captures the winner’s curse to some degree. However, it will not be able to account for interaction effects between experiments.
Velocity
The Velocity module shows the number of experiments run by each team for the selected time period.
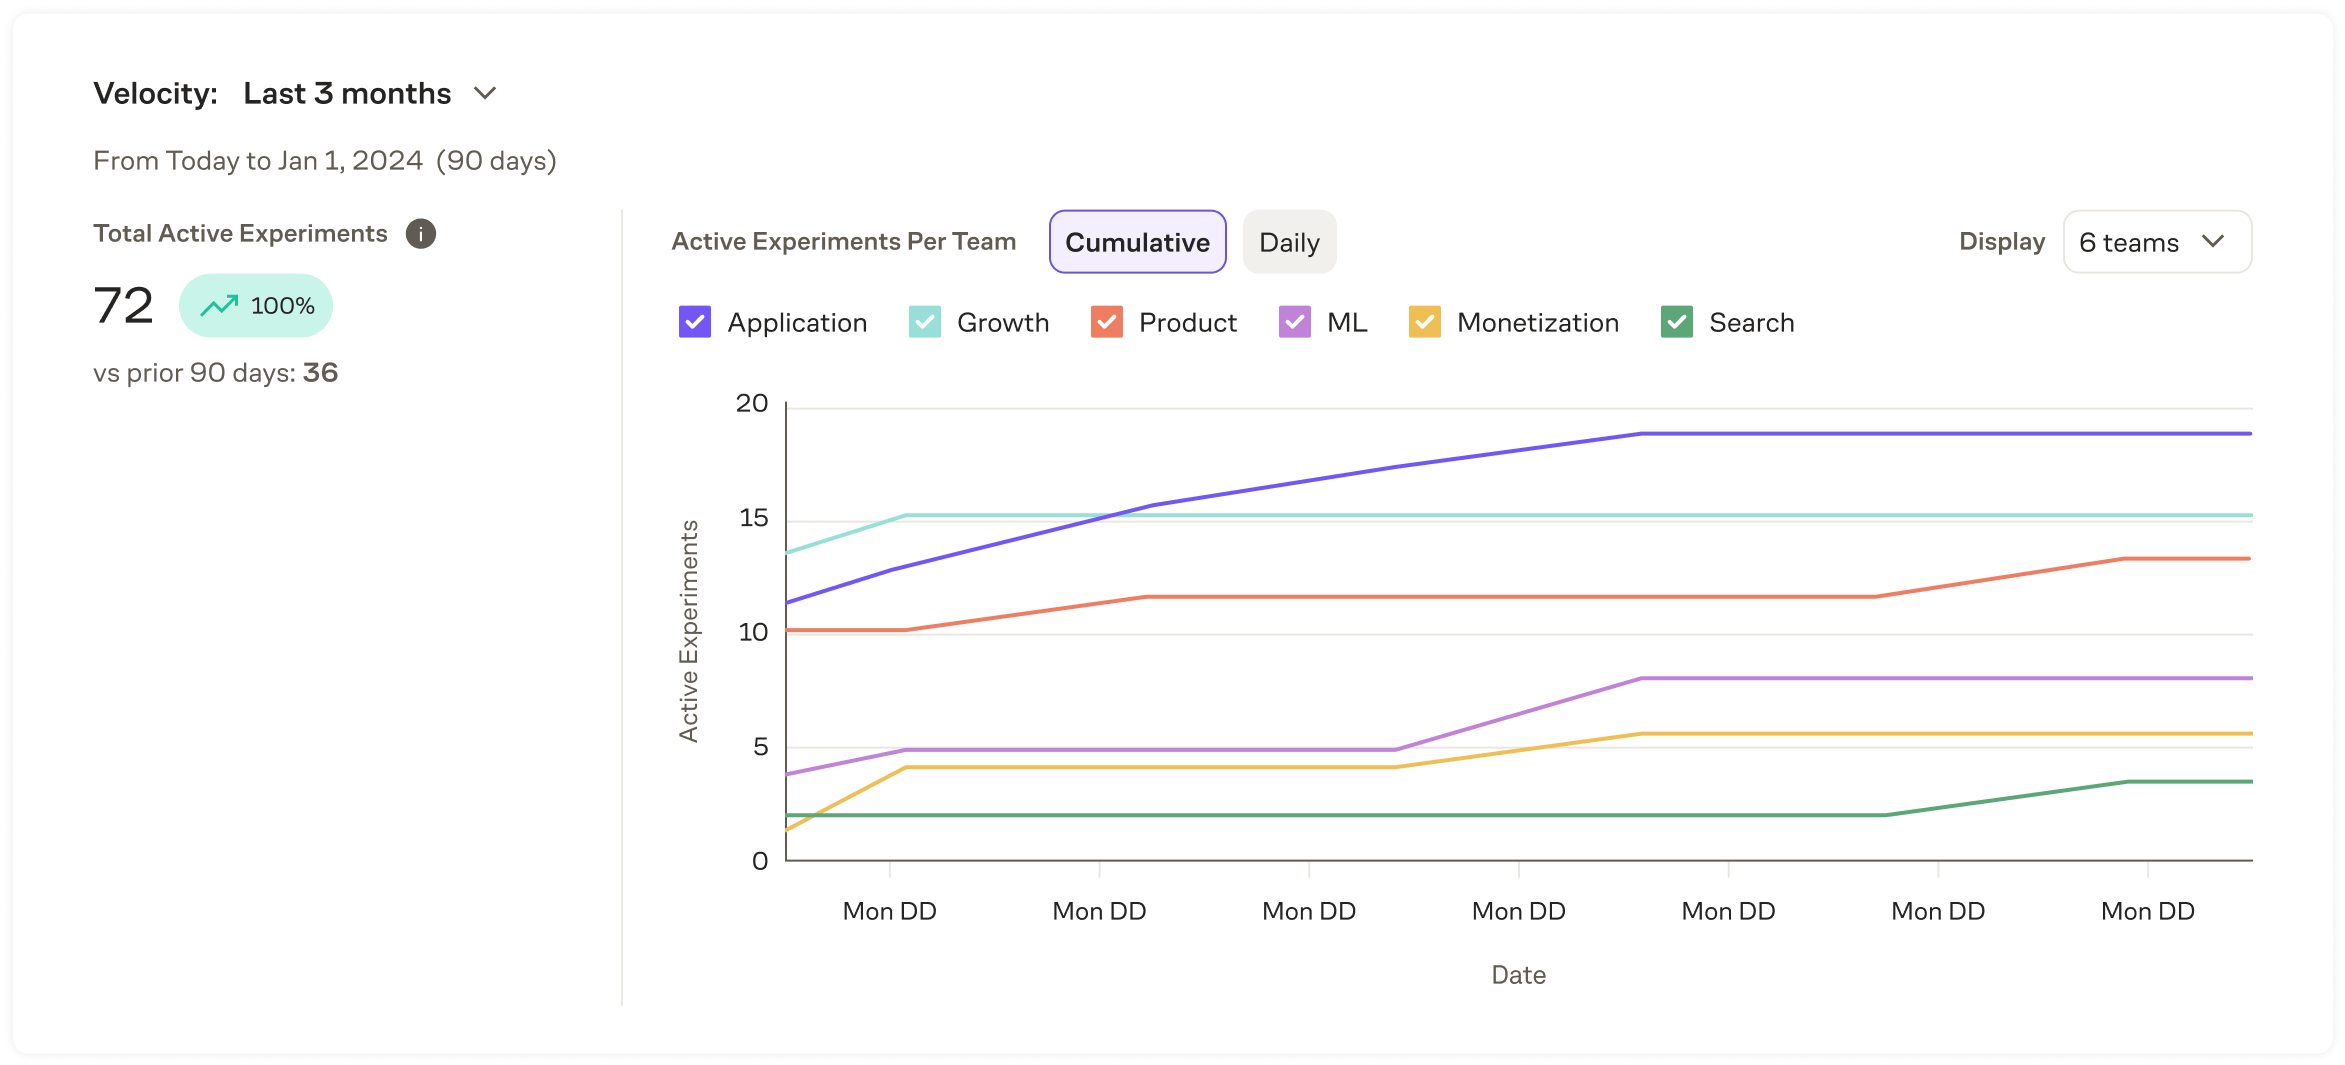
An experiment is counted as active if it has a status of Running or Ready to Review.
Eppo also reports on how the selected time frame compares to the previous time frame of the same length. The view can be toggled between cumulative (default) and daily.
Quality
The Quality module reports on the quality of experiments run by each team within the time period selected. This can help understand if a team needs help improving the quality of the experiments they run, helping them save time and increase the number of high quality experiments they run.
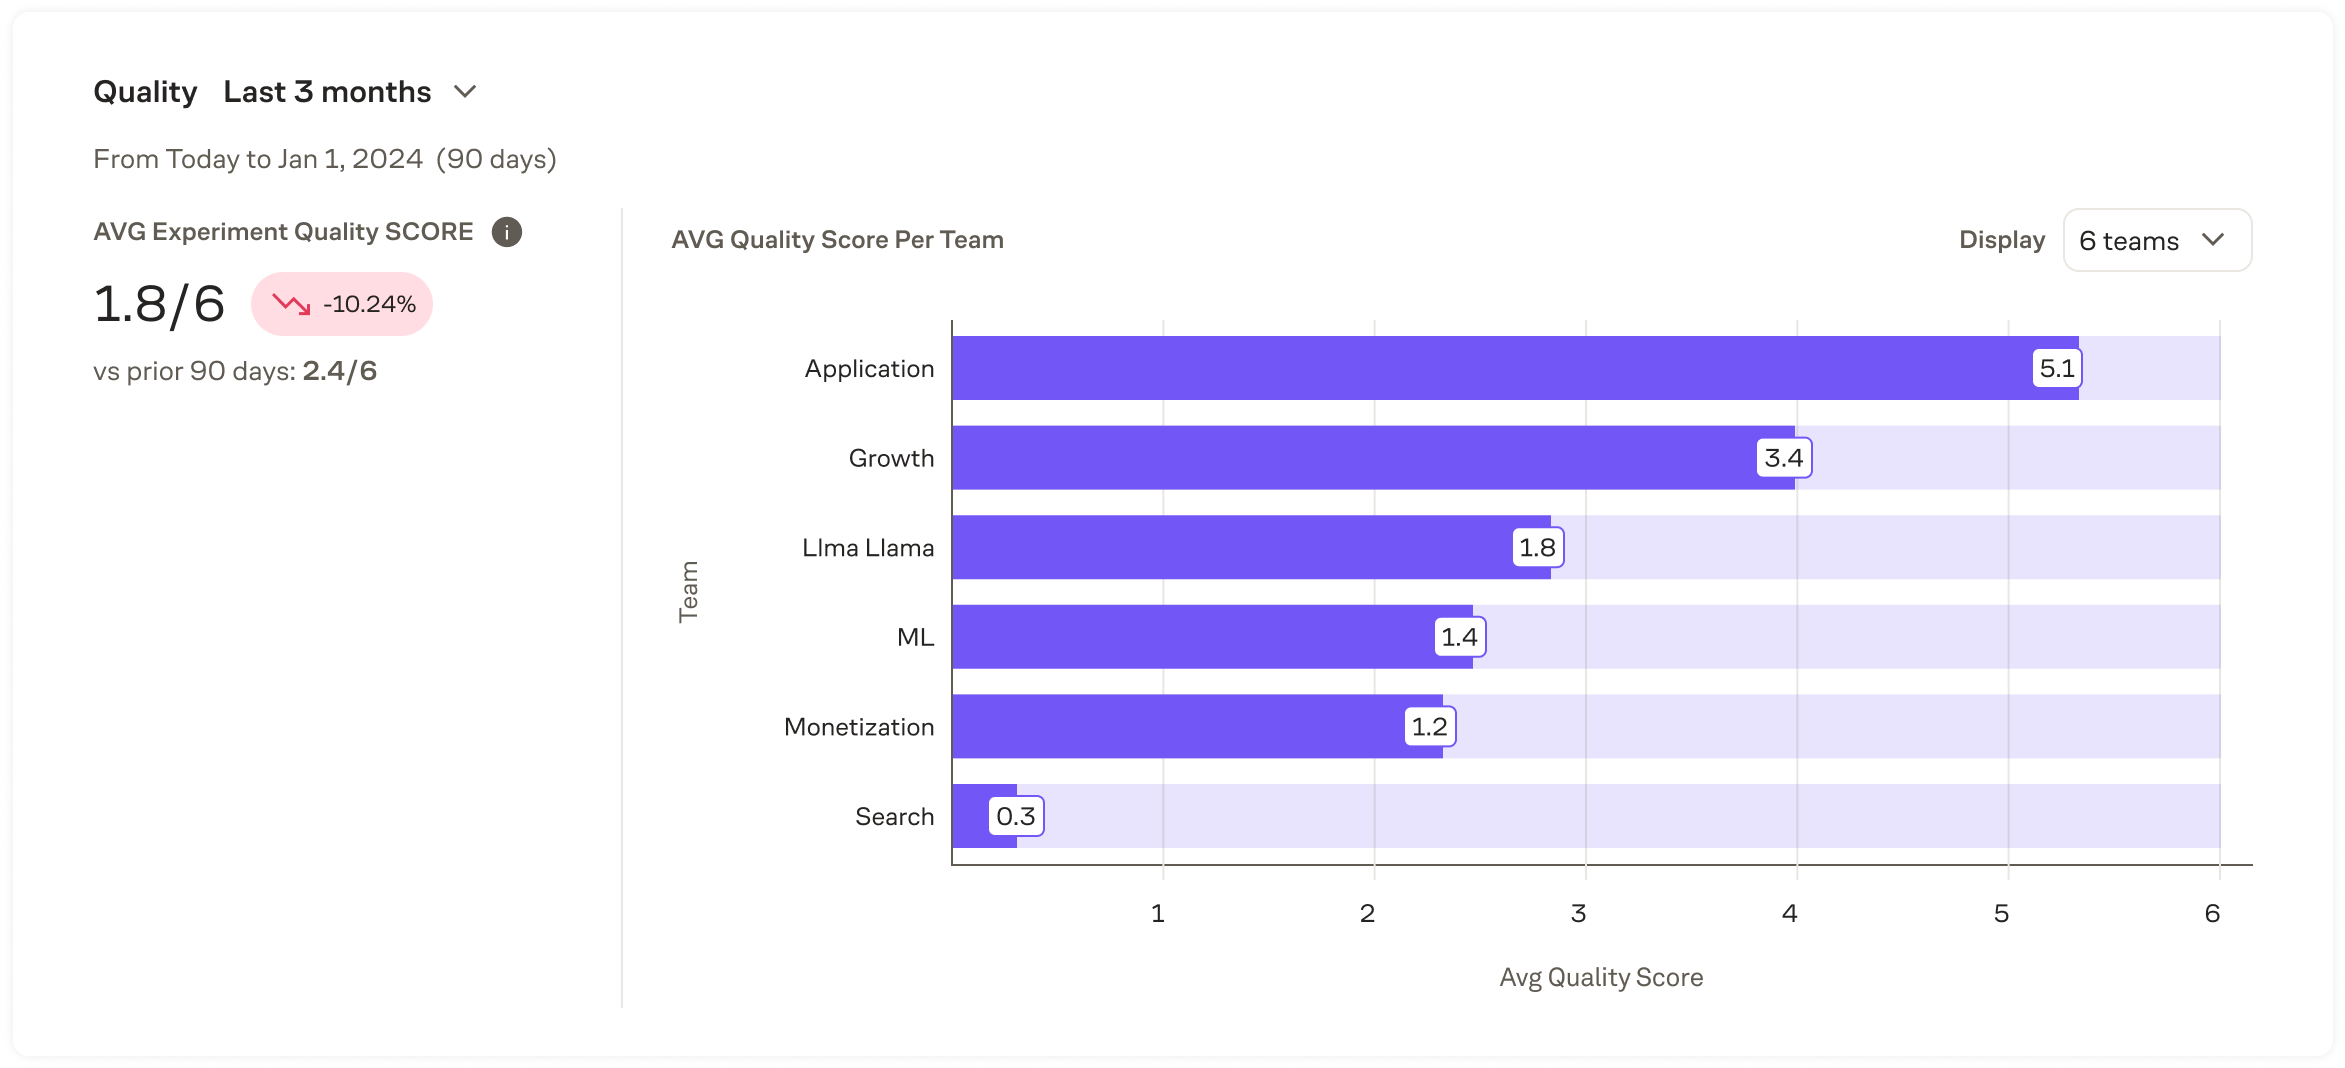
The Experiment Quality Score measures the completion rate for the following checklist of items:
- A hypothesis exists for the experiment
- The experiment contained guardrail metrics
- No traffic imbalances were present
- No diagnostic data errors were present
- The minimum runtime thresholds were met
- The experiment ran to the targeted precision
The score looks at the average of past experiments within the timeframe. Misconfigured experiments are excluded. For example, if an experiment completes 3 of the 6 items, the quality score will be 3 out of 6.
Win Rate
The Win Rate module reports on how often treatments are shipped by team. This helps teams understand if they are playing it too safe by testing hypotheses with obvious winners or if they are being too risky without a well formed hypothesis that results in reverting to control experiences.
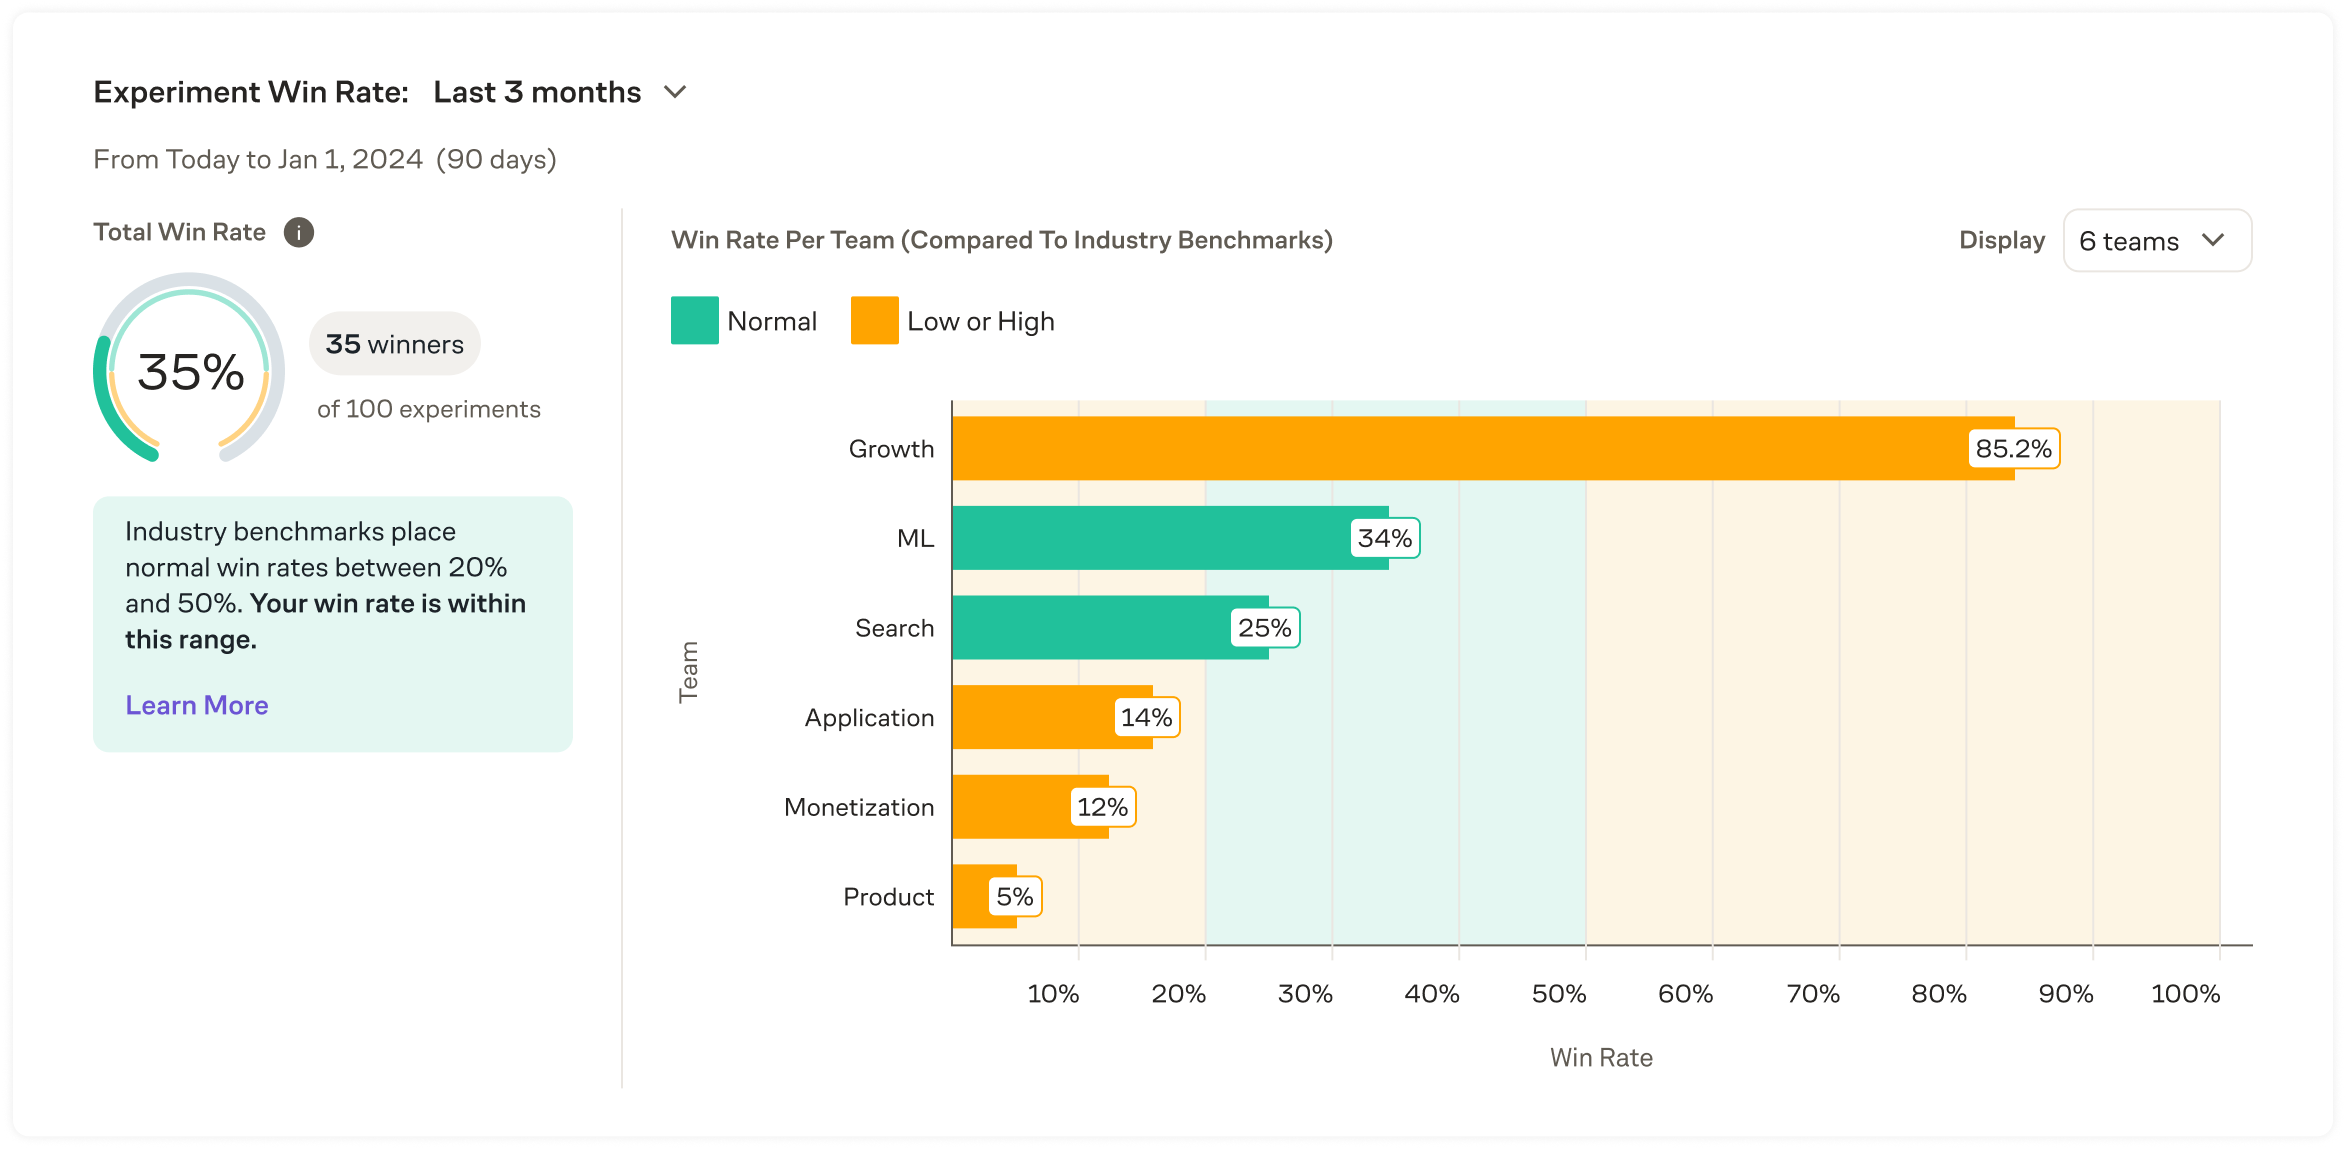
Winning experiments are based on Concluded experiments where a non-control variant is shipped compared to the total number of Concluded experiments without a misconfiguration.