Experiment Run Log
The Run Log provides visibility into how Eppo processes experiment data in your warehouse. This tool helps you audit your pipeline, debug broken queries, and optimize experiment refresh times.
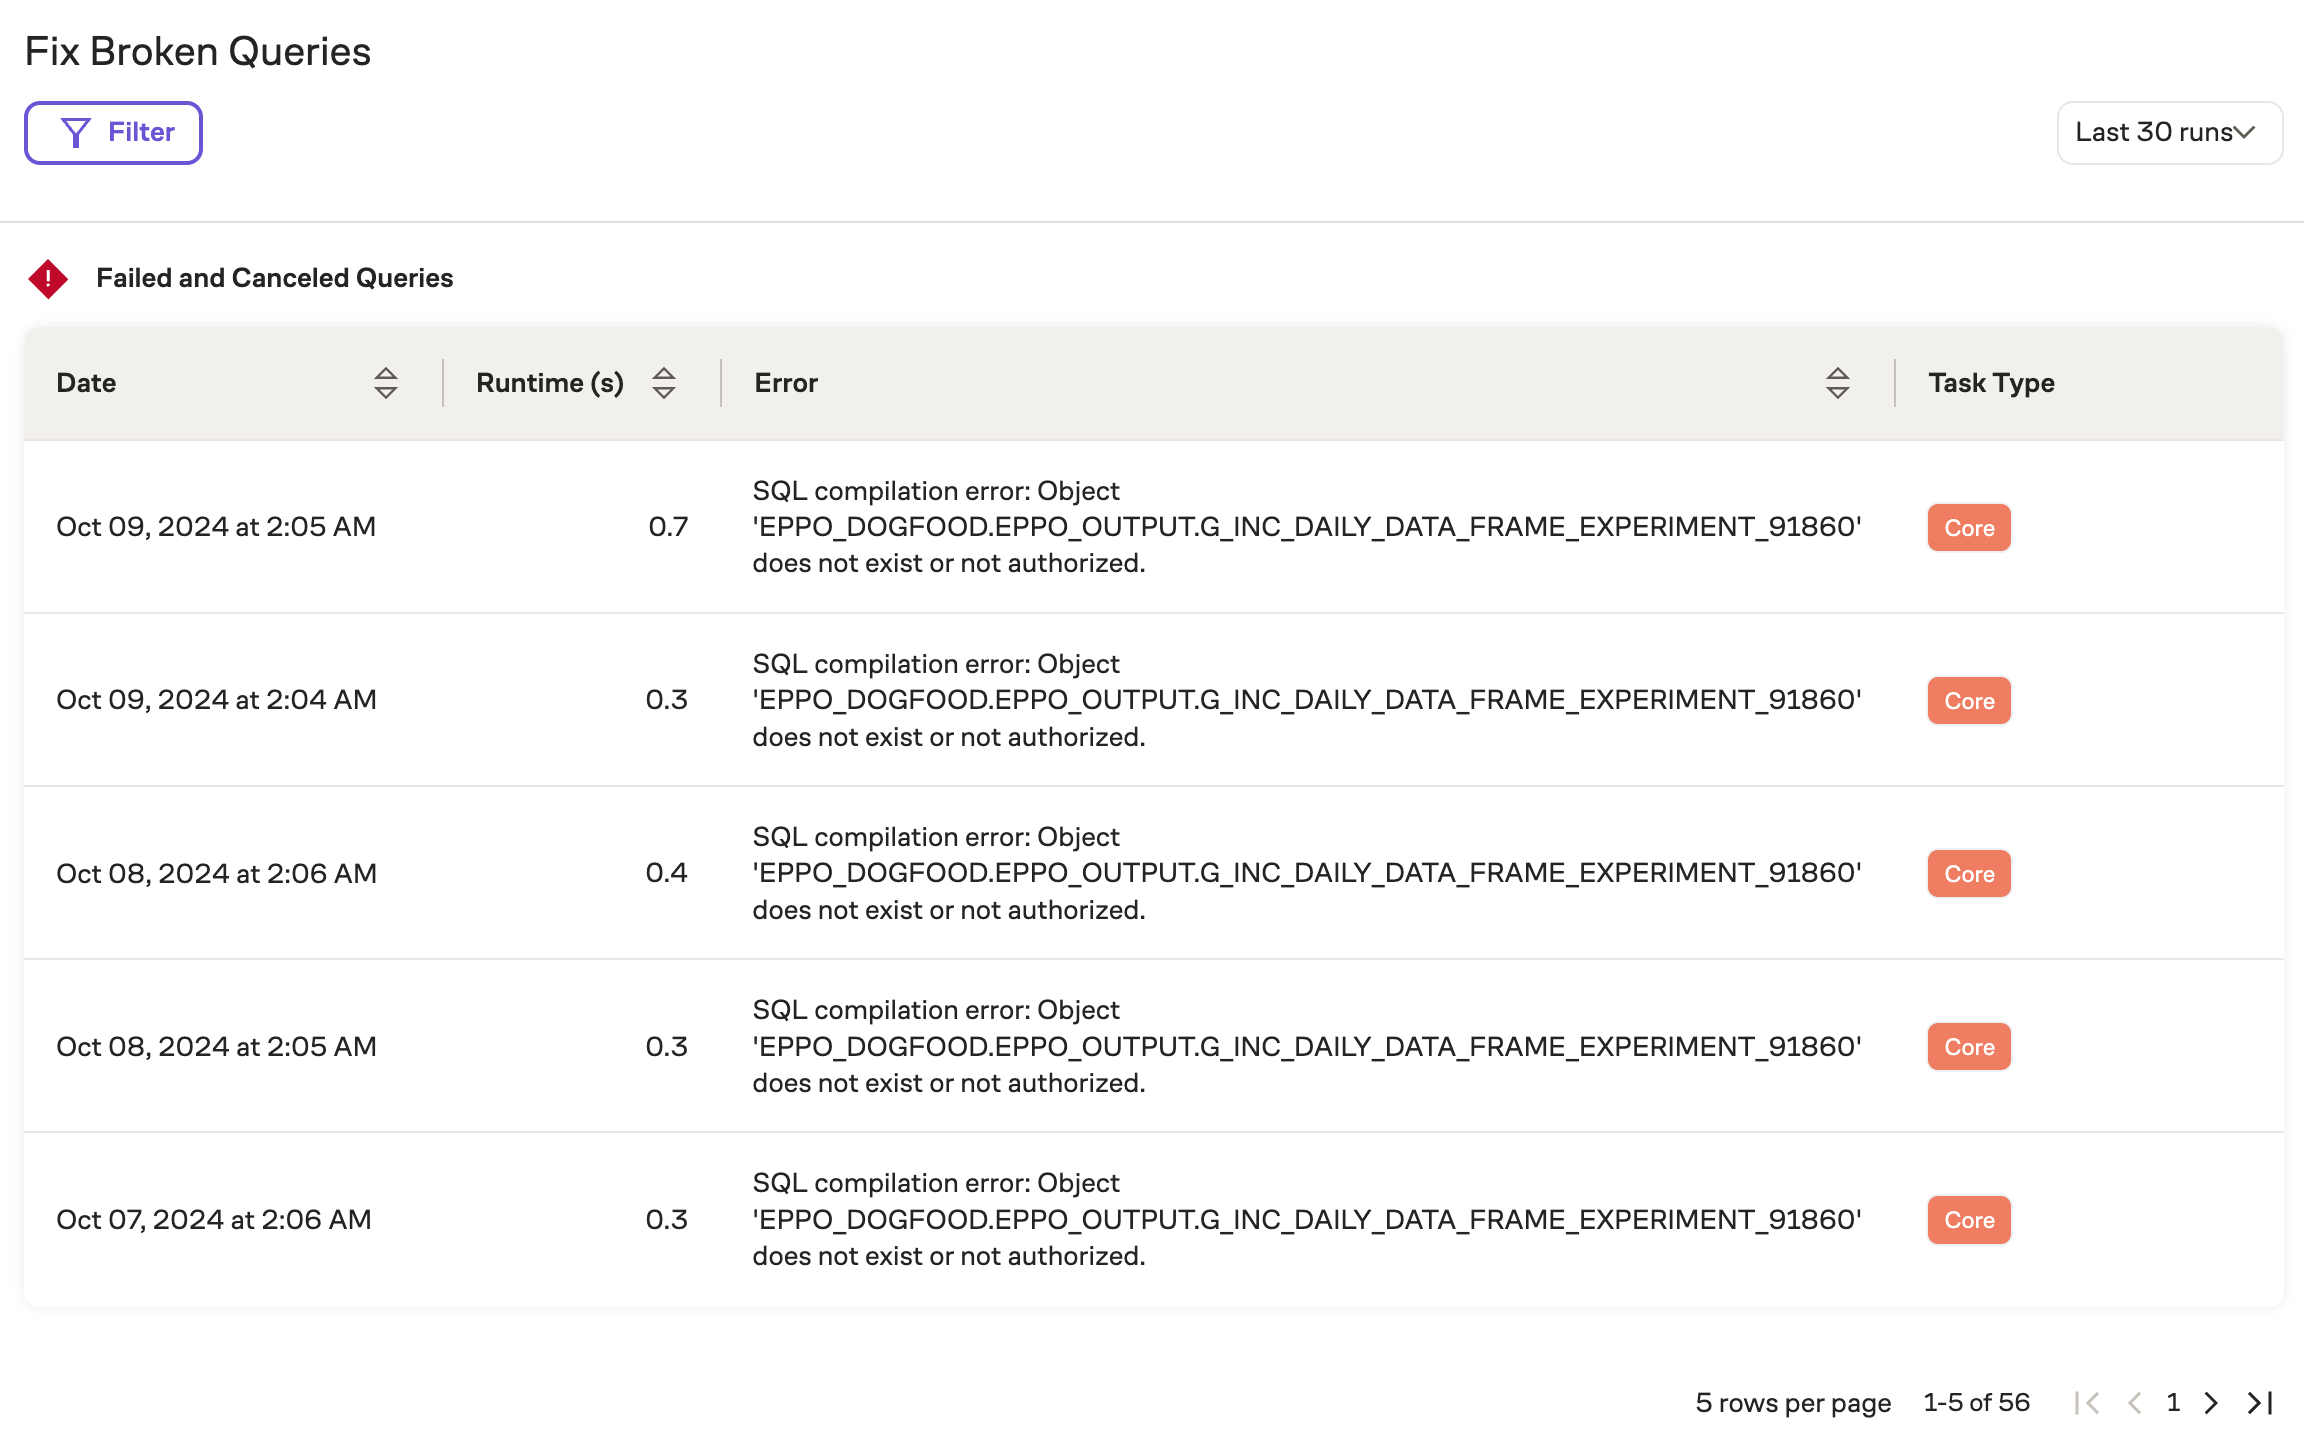
Fix Broken Queries
The Run Log highlights any pipeline failures during refresh, whether from errors or timeouts. For each failed query:
- Click "query details" to view the SQL that caused the error
- Copy the SQL to execute and debug locally
- Review the list of affected metrics to understand the failure's impact
Identify Long Running Tasks
The Long Running Tasks view shows how long each pipeline component takes to execute. The visualization includes:
- A timeline chart showing runs from earliest to latest, with color-coded pipeline components
- A sorted list of cumulative time per task type
Learn more about pipeline components here.
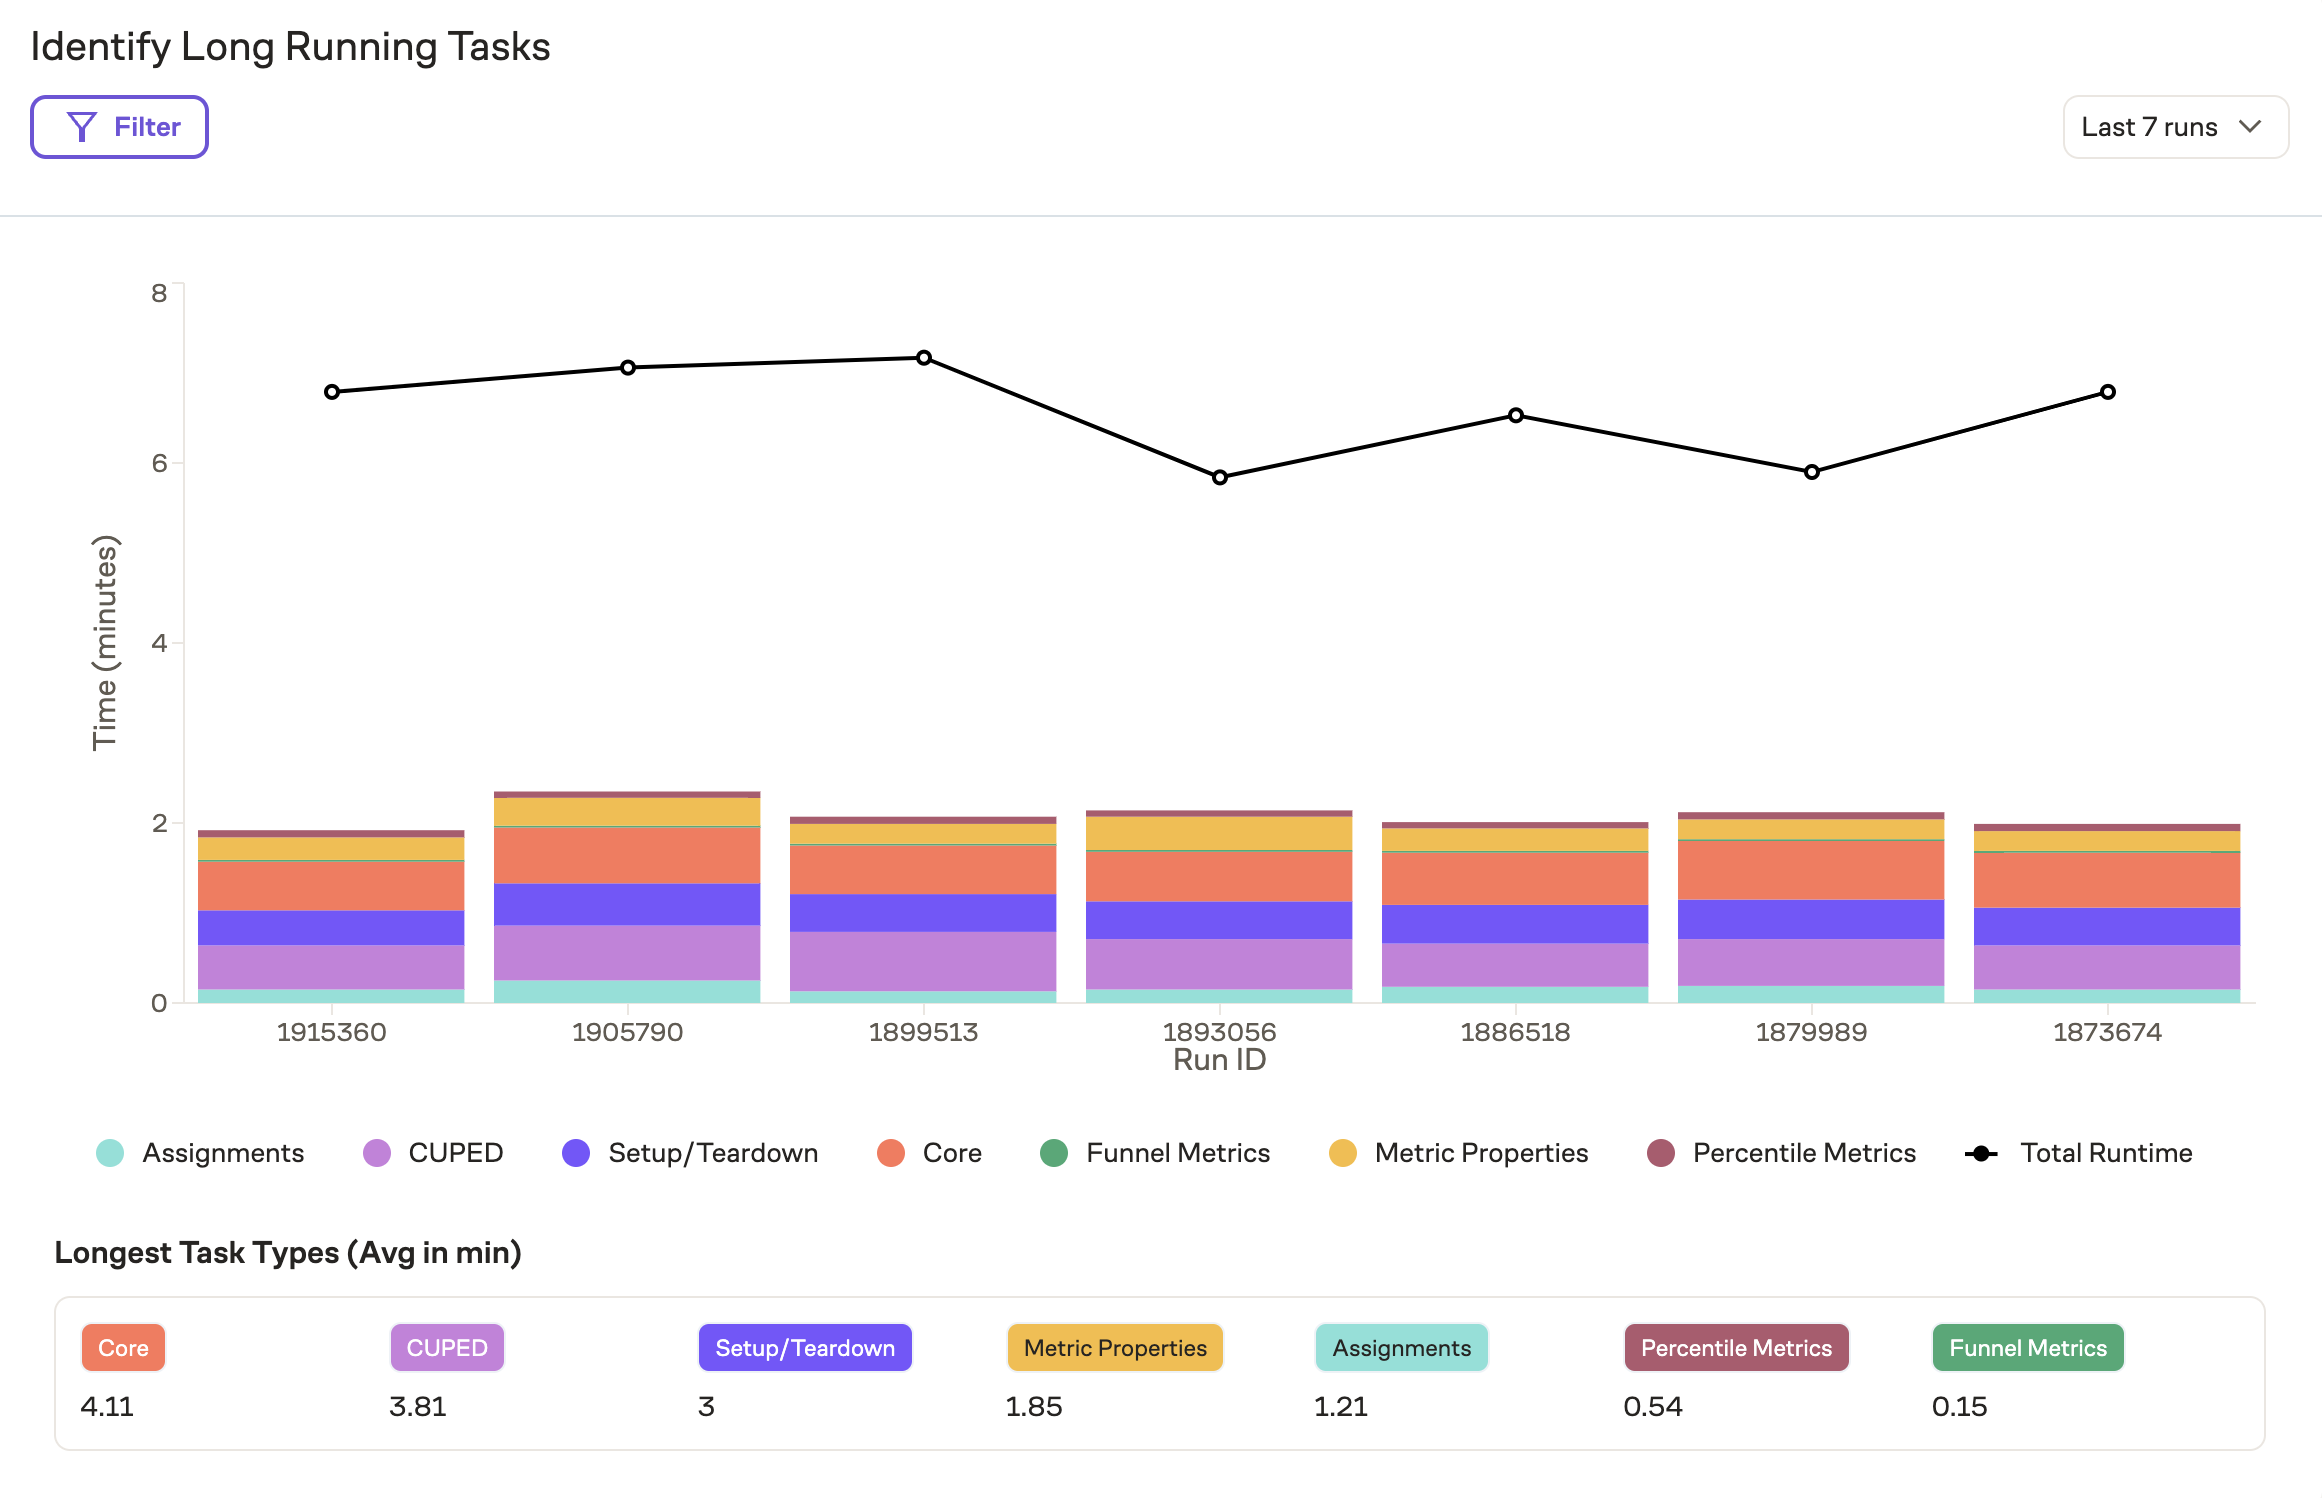
If certain tasks consistently take a long time, consider whether they're necessary for your analysis. For example, if Percentile Metrics are the slowest component, you might:
- Remove them if they aren't critical to your analysis
- Optimize the underlying SQL queries
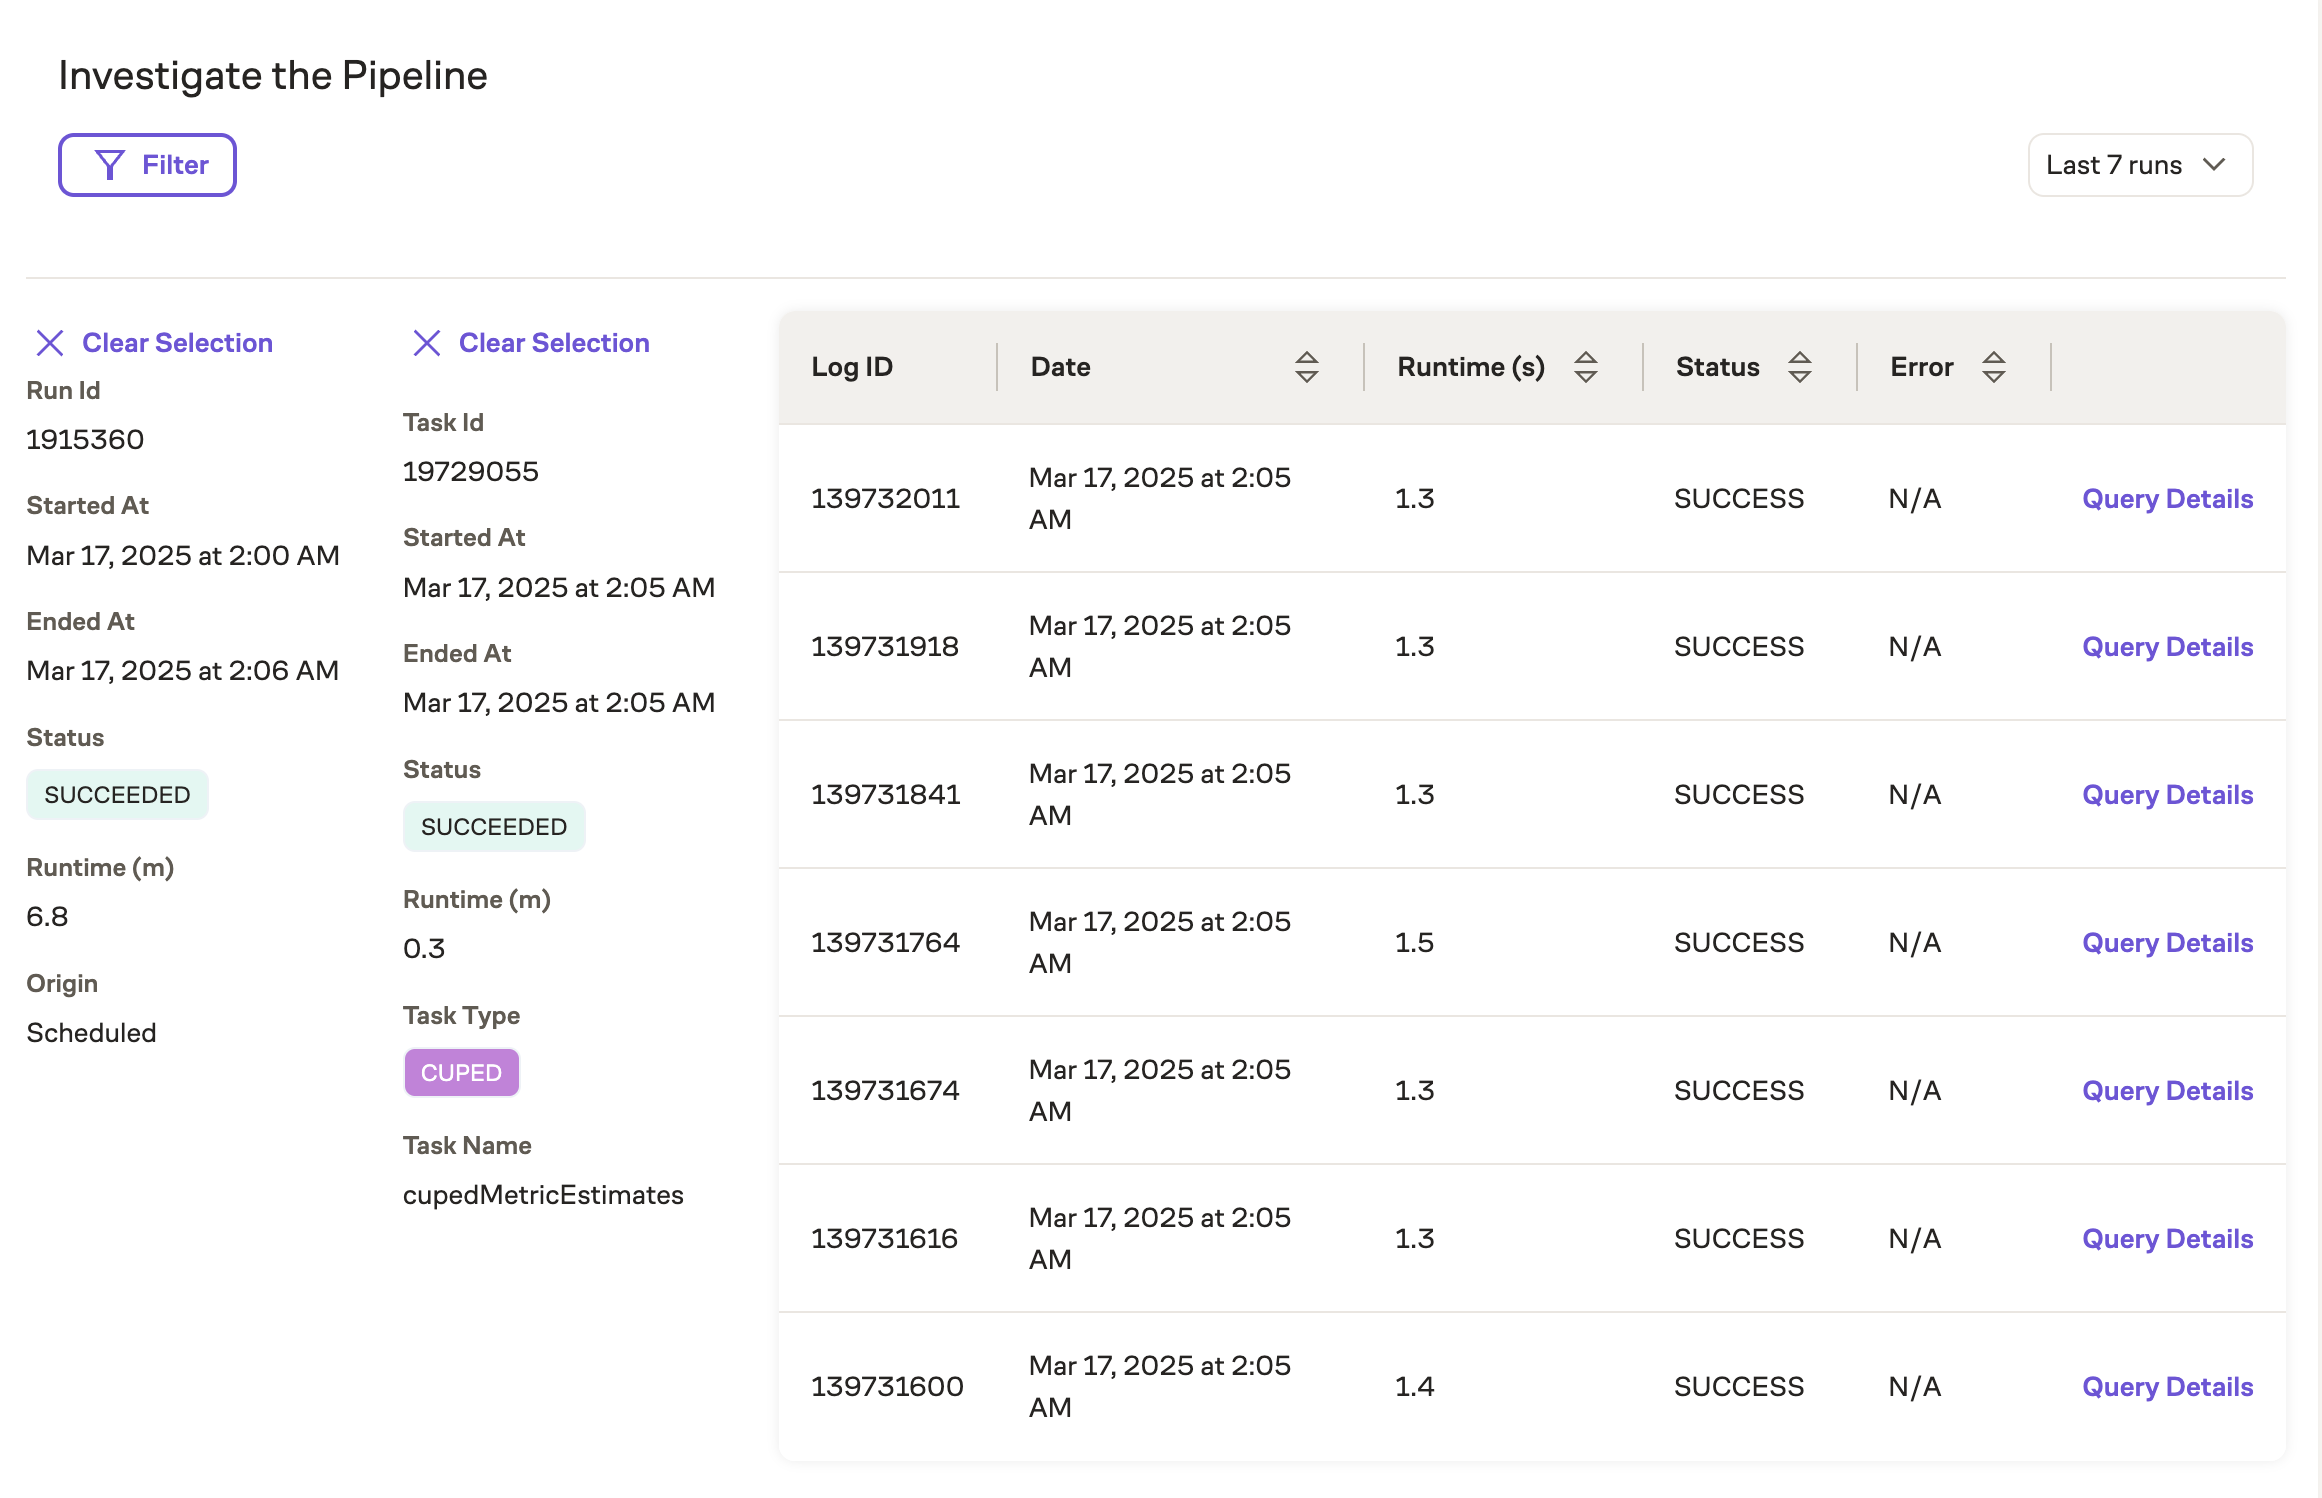
Investigate the Pipeline
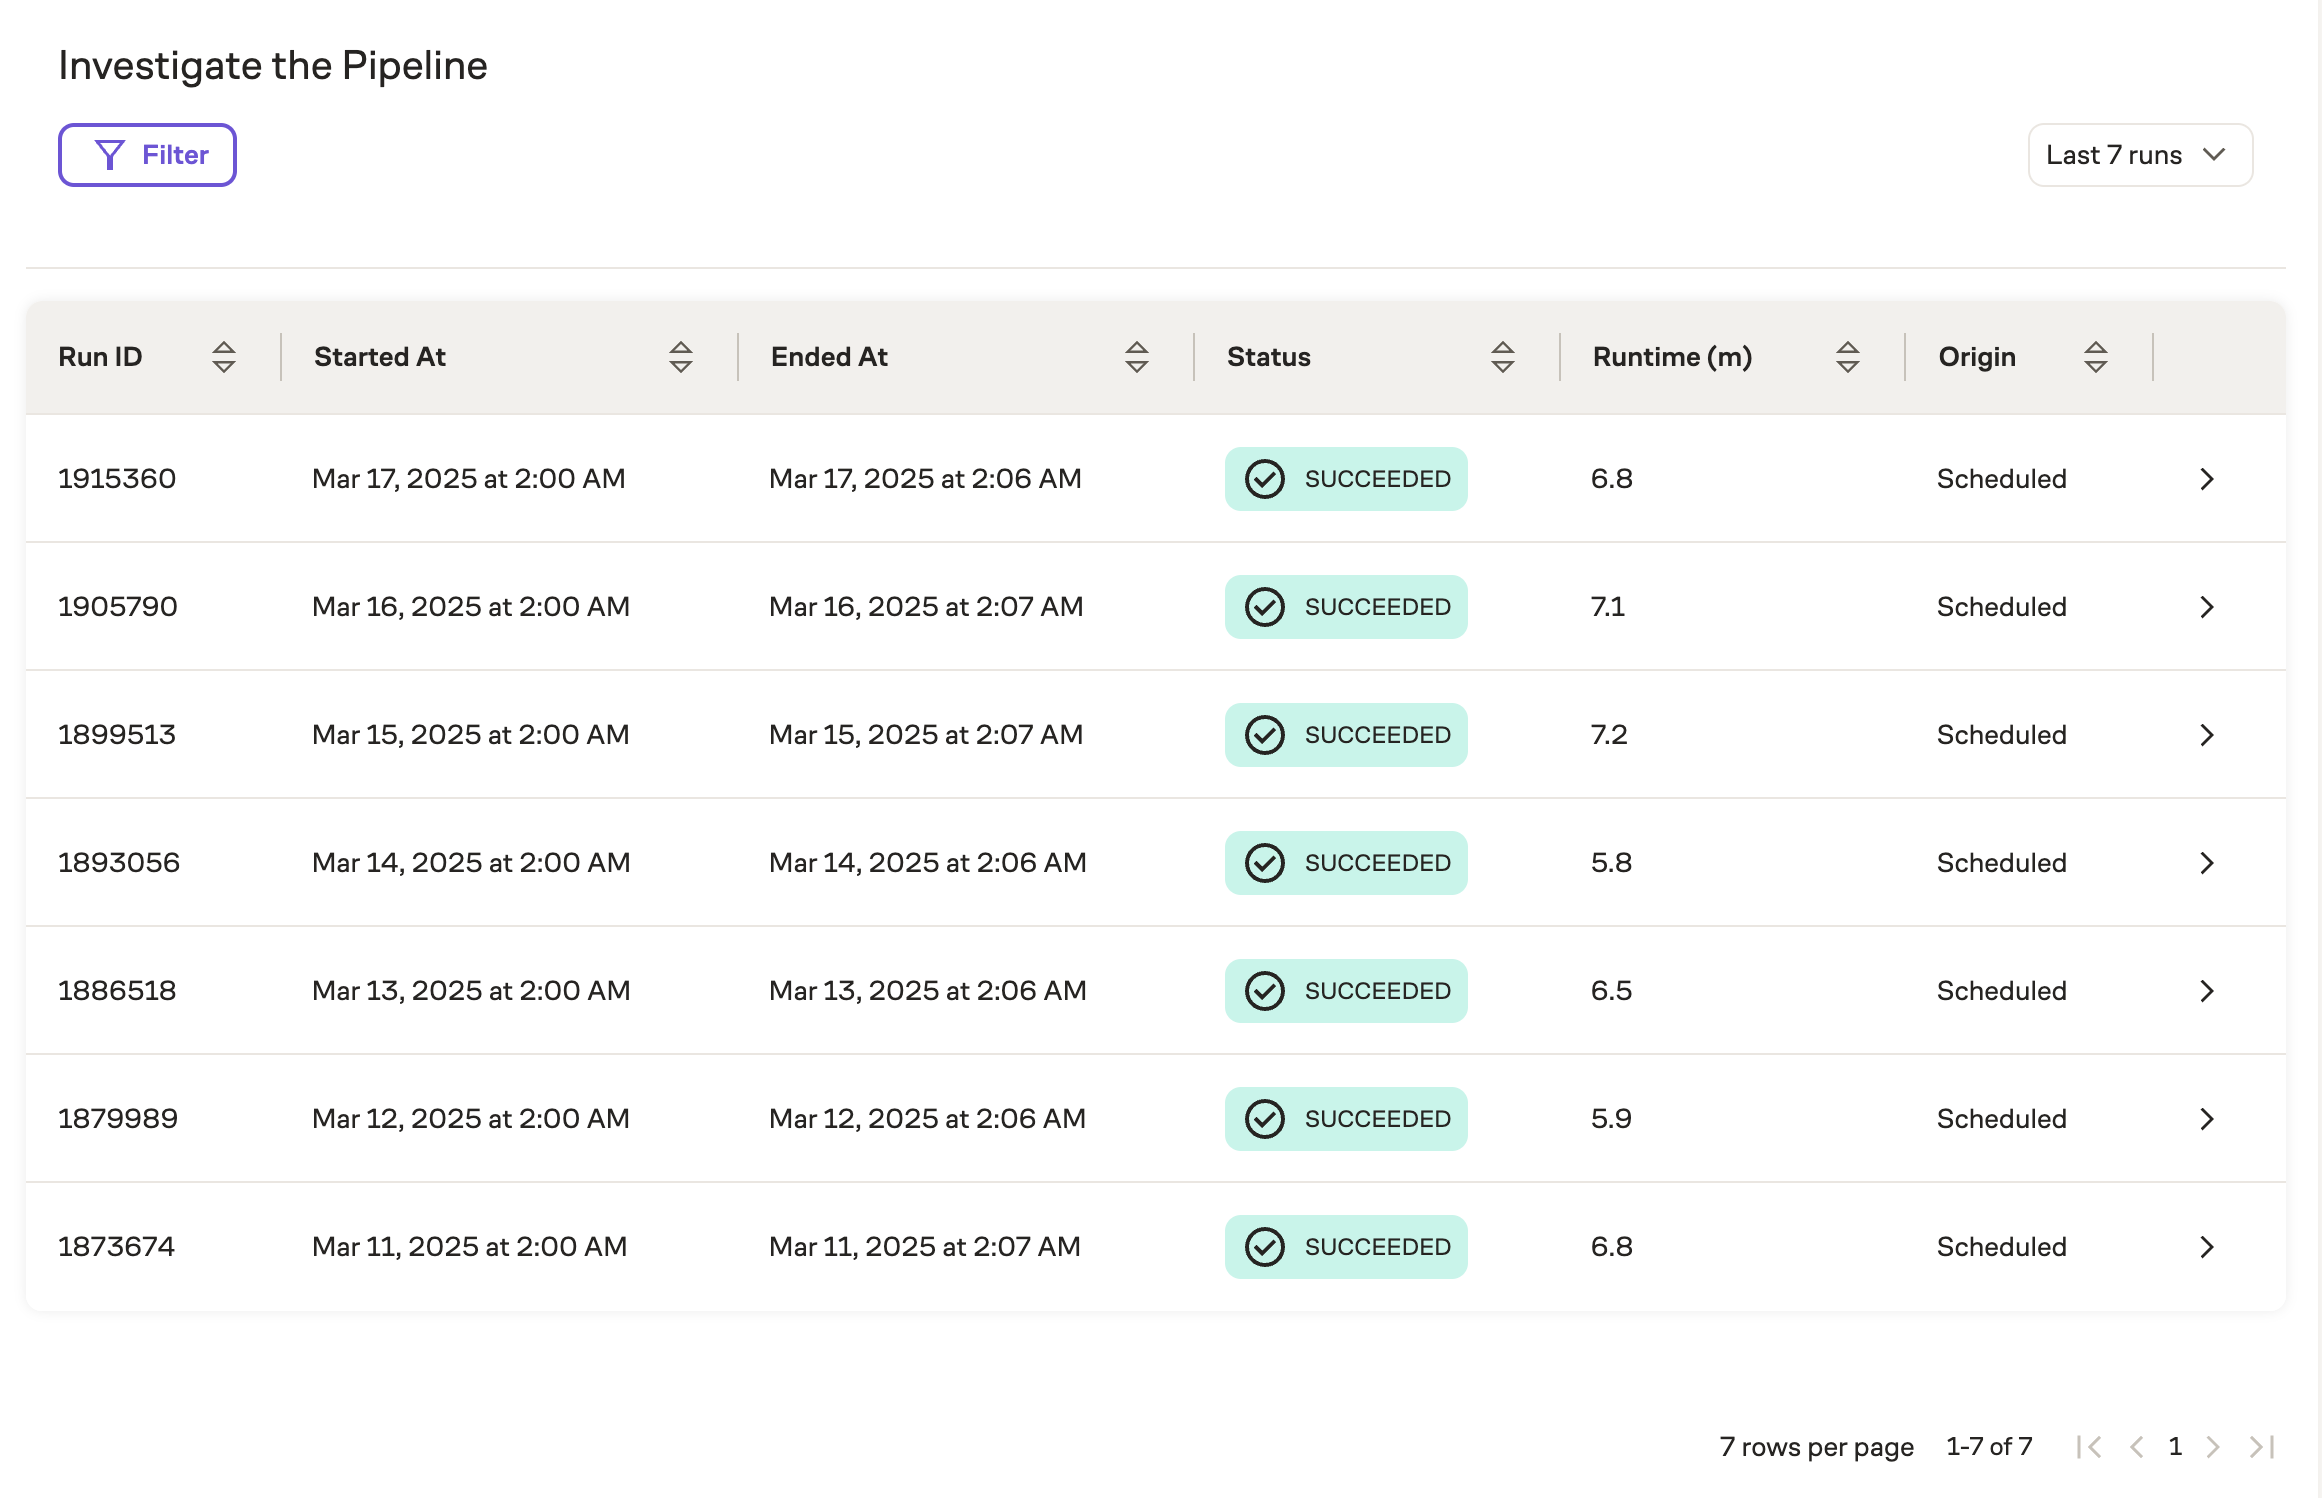
The Pipeline Investigation view lets you examine every task in every run. For each run:
- Click any row to see its underlying tasks
- Click any task to view its details
- Click any log to see the executed query
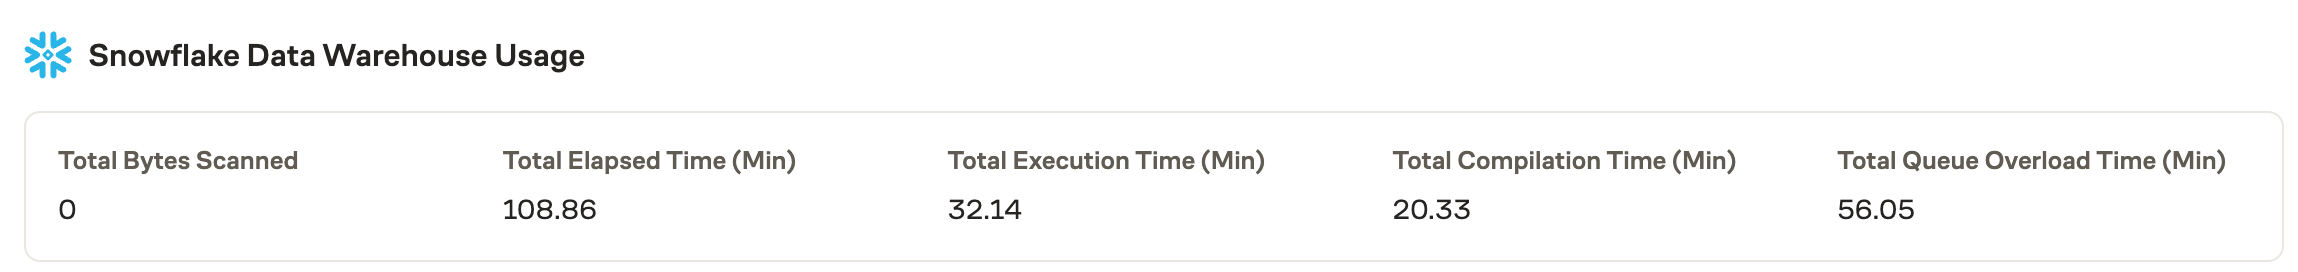
For Snowflake and BigQuery users, a warehouse usage module shows:
- Bytes scanned
- Execution time
This helps you understand Eppo's resource consumption per experiment.