Metrics
Metrics serve as the foundation for evaluating experiments and determining the effectiveness of different variations. This overview provides a brief introduction to metrics in Eppo and highlights their significance in data-driven decision making.
Entities and aggregations
Metrics in Eppo are created at the entity level (such as a user), allowing you to define specific measurement criteria for different aspects of their experiments. An entity can be any meaningful unit of analysis, such as a user, session, or page view. To capture meaningful insights, metrics combine a fact and an aggregation. The fact represents the event or action being measured, while the aggregation defines how the data is summarized (e.g., sum, count, conversion, and retention) across the specified entity.
Ratio Metrics
Ratio metrics allow you to calculate ratios based on different metrics, providing deeper insights into the relative performance of variations. This enables a more nuanced analysis of experimental results, allowing businesses to understand the impact of changes in a more comprehensive manner.
For example, consider an average order value metric, which is created by dividing revenue (sum of prices) by number of orders (sum of items purchased or count of prices).
Funnels
Funnels are another powerful metric type in Eppo. They allow you to track and analyze multi-step processes or user flows. By defining the sequence of events in a funnel, you can identify bottlenecks, drop-off points, and conversion rates at each step. This facilitates a granular analysis of user behavior and helps optimize the customer journey.
Percentiles
Percentile metrics enable measurement of product and website performance. Page load time is a good example of when you want to use a percentile metric. For example, average page load time is heavily influenced by outliers, such as when the page didn’t load properly or at all and the load time is very high. The goal instead is to reduce load time for slow loads. Percentile metrics solve for this by using p75 (the 75th percentile), p90, or p95 page load time to measure tail behavior.
Guardrail cutoffs
There are a number of experiments where you want to monitor that a metric is not positively impacted, but you also want to ensure there is no negative effect either.
In this case, you can set metrics to have a guardrail cutoff, which means they will appear with a downside threshold. When the lower bound of the confidence interval for the metric breaches the threshold, the metric will display a warning state.
Add metric to all experiment analyses
Often you want to ensure specific metrics are consistently tracked across experiments, providing a standardized measurement framework. You can do this by setting metrics to automatically be added to every experiment. In doing so, you can maintain a unified approach to experimentation and easily compare results across different tests.
Metric detail view
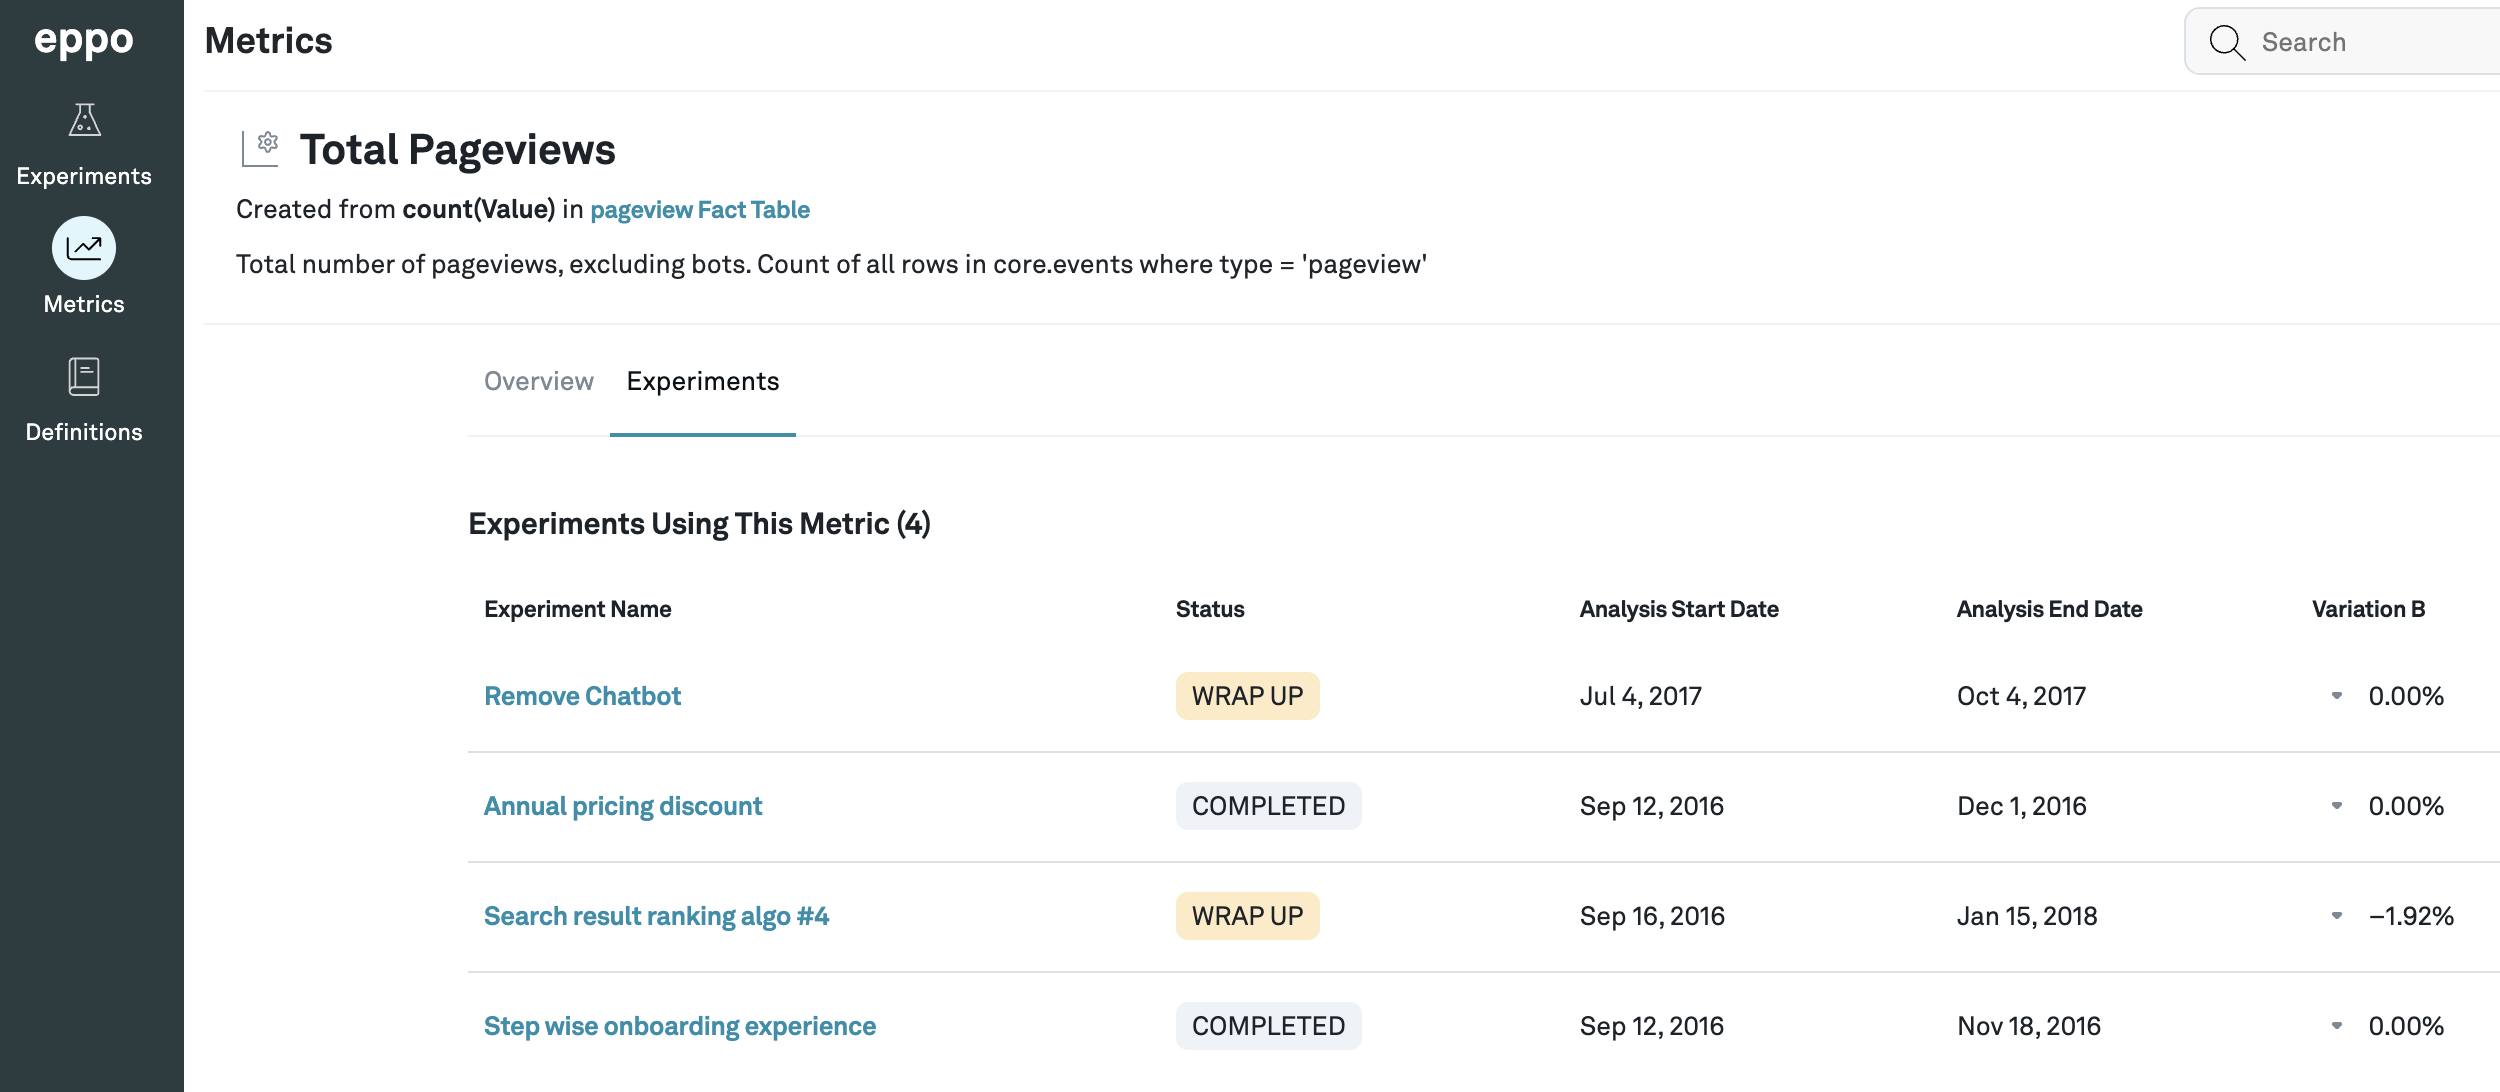
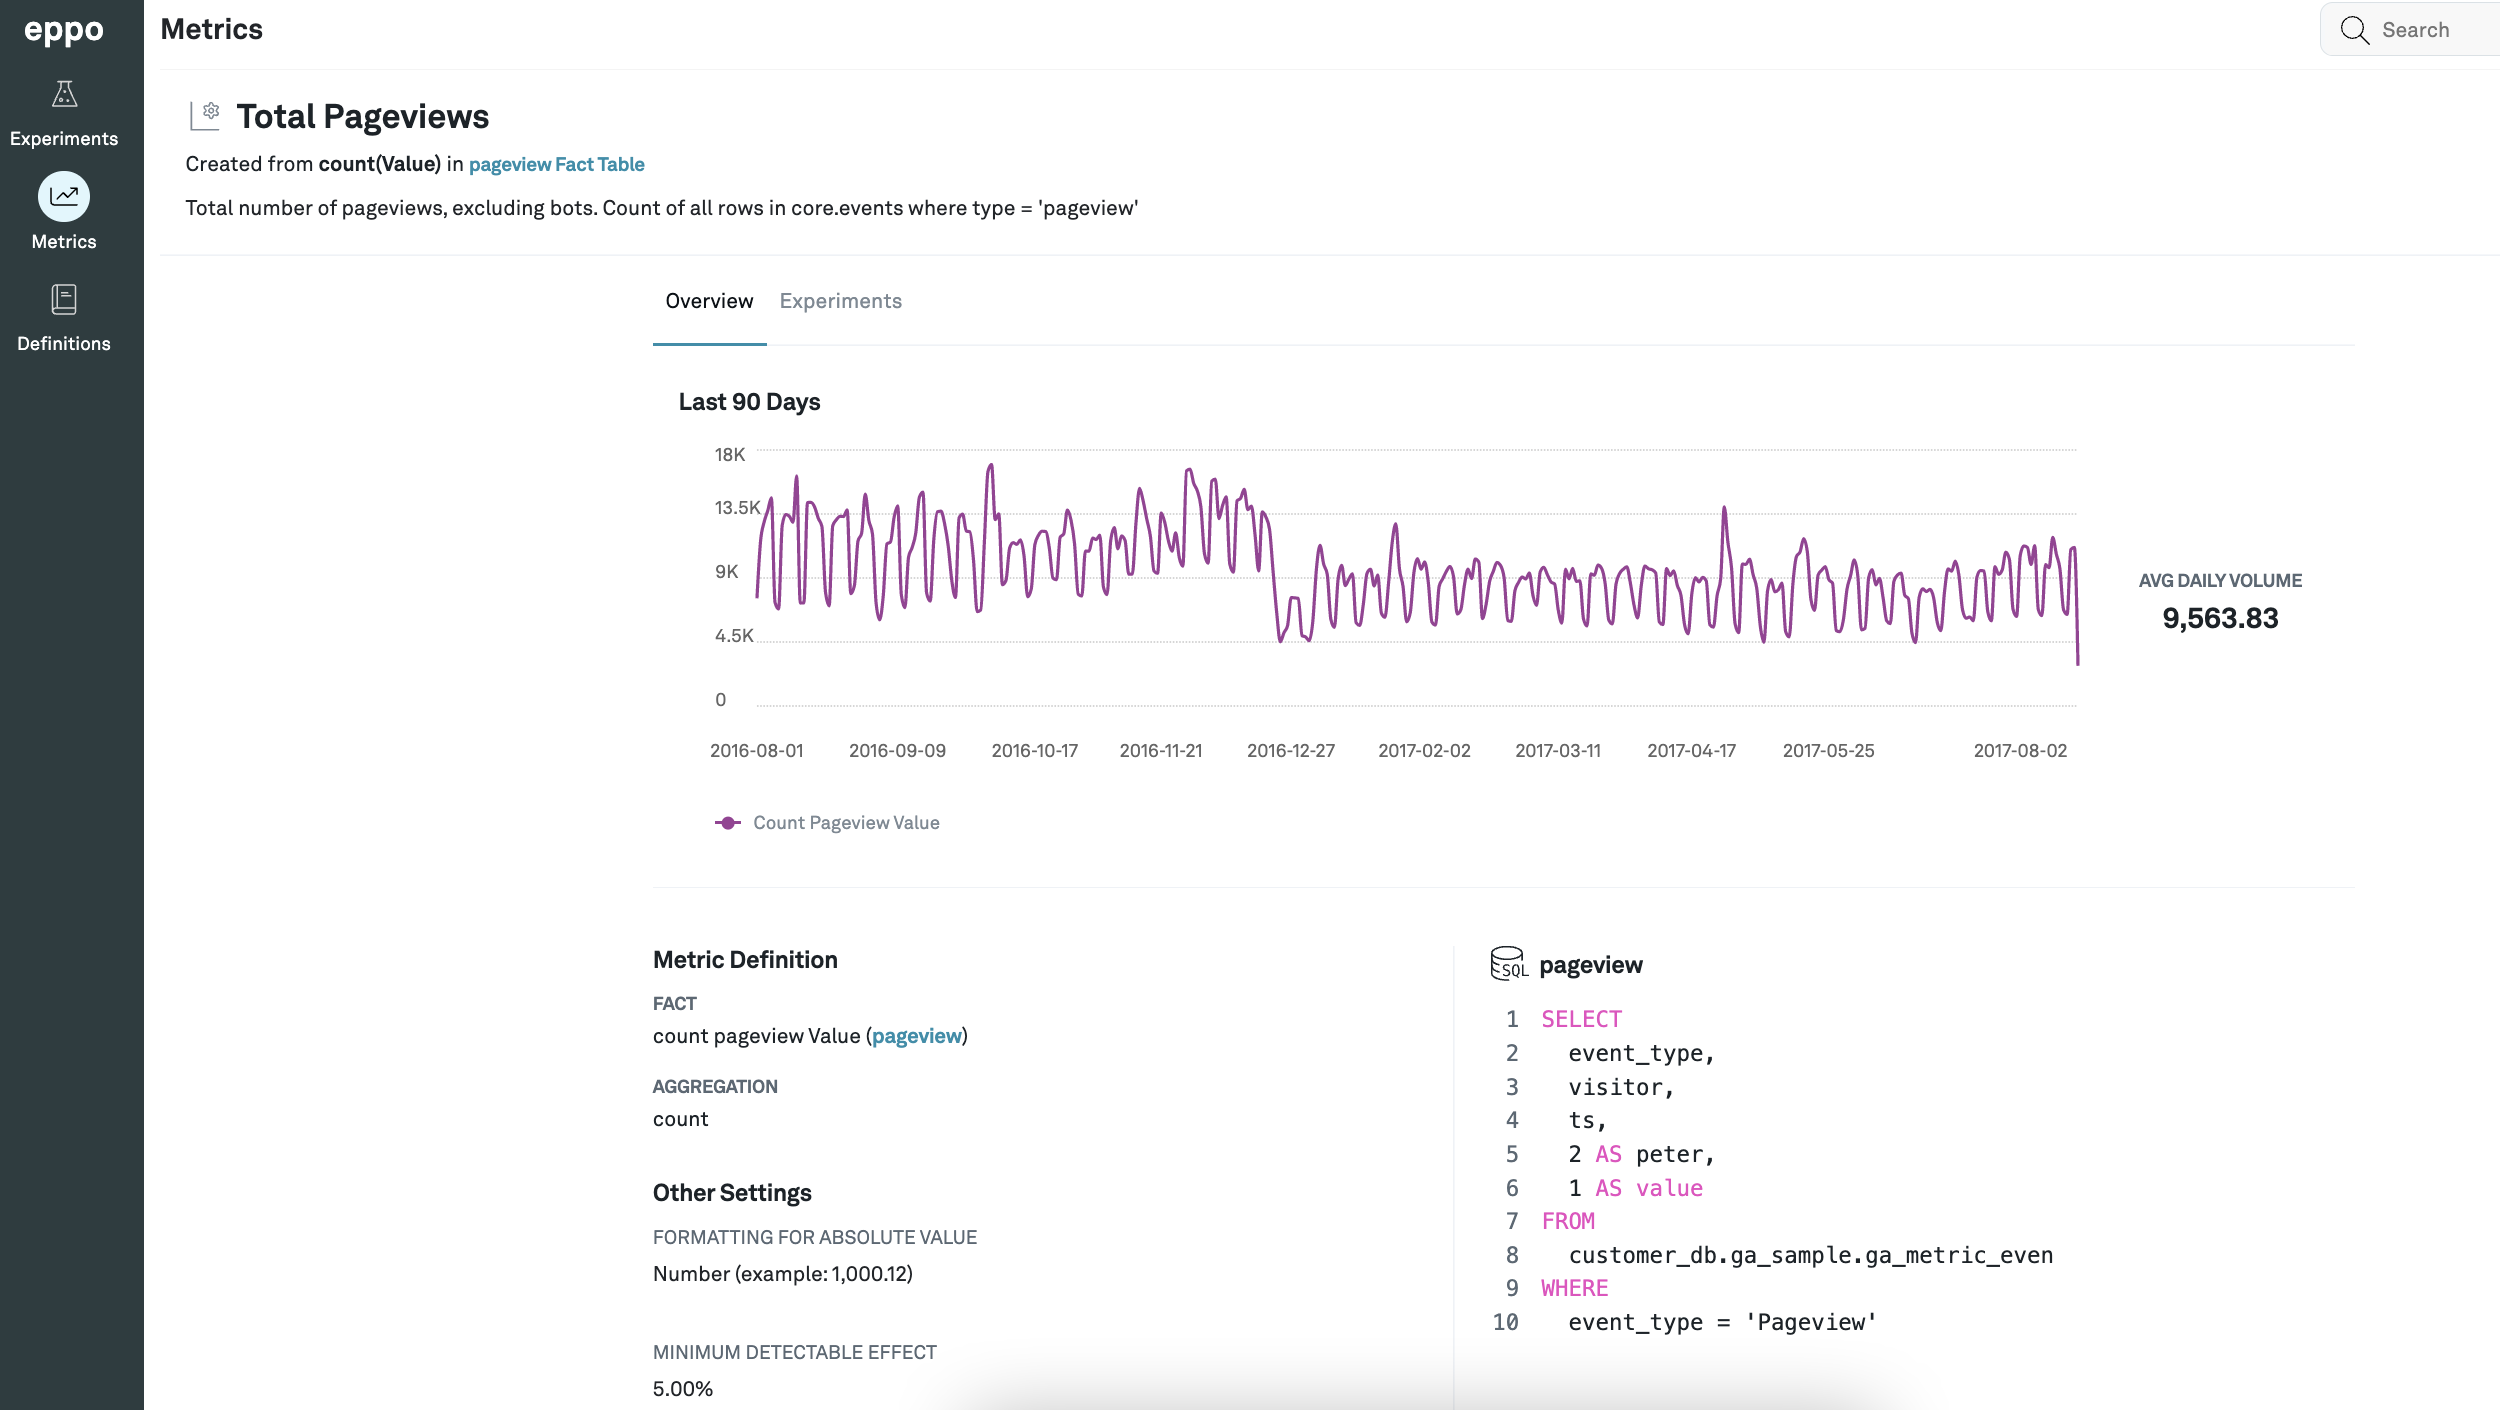
If you click on any metric listed under the Metrics tab, you can see more details about it. The details page consists of two tabs: Overview and Experiments.
The Overview tab contains a graph of the metric value against time along with an average for that time period. It details the fact and aggregation being used and the minimum detectable effect set for that metric. It also shows the SQL query being used to calculate that metric.
The Experiments tab shows a list of all the experiments that are considering this metric. This is helpful when you want to see what which ongoing experiments may be affecting a particular metric you care about.