Warehouse Best Practices
Eppo's warehouse native approach makes integration easy, transparent, and secure but it also creates a dependency on the underlying warehouse database structure. Knowing how to configure your tables to work with Eppo properly is important to minimizing runtimes and compute used.
This page outlines some best practices to help keep Eppo's data pipeline as lightweight as possible.
Materialize data upstream of Eppo
Eppo's SQL editor makes it easy to quickly pilot new SQL logic, but in the steady state all complex logic (joins, aggregations, etc.) should happen upstream of Eppo in your data warehouse's transformation layer. In Eppo, the SQL should then be a simple SELECT ... FROM statement (just make sure the table is materialized as a table and not a view).
By materializing data upstream of Eppo, you can avoid having Eppo perform complex joins and aggregations separately for each experiment. Simple WHERE statements are typically fine to include in Eppo, just avoid JOIN and GROUP BY.
Pre-aggregating high volume data sources
If your metric sources are extremely large you might want to consider aggregating up to the subject-day grain (e.g., daily user values) before adding to Eppo. For example, imagine you have a large table of user events. This table might look something like this:
| user_id | event_type | timestamp |
|---|---|---|
| 123 | login | 2024-01-01 00:01:00 |
| 123 | search | 2024-01-01 00:01:15 |
| 124 | login | 2024-01-03 00:02:00 |
| 124 | search | 2024-01-04 00:02:20 |
| 124 | search | 2024-01-04 00:02:40 |
| 125 | support_ticket | 2024-01-05 00:03:05 |
Instead of pointing Eppo at this table directly, consider creating a pre-aggregated table:
| user_id | event_type | date | event_count |
|---|---|---|---|
| 123 | login | 2024-01-01 | 1 |
| 123 | search | 2024-01-01 | 1 |
| 124 | login | 2024-01-03 | 1 |
| 124 | search | 2024-01-04 | 2 |
| 125 | support_ticket | 2024-01-05 | 1 |
If you're using a data transformation tool such as dbt, you can create a table like this with the following SQL:
select
  user_id,
  event_type,
  date(timestamp) as date,
  count(*) as event_count
from user_events
group by 1, 2, 3
You can now use this aggregated table as a fact source in Eppo and build metrics off of it just like any other fact source.
If you opt to pre-aggregate data, make sure you truncate the assignment date to the start of the day to avoid losing data from the day of assignment. Remember that Eppo only includes events that occur after the subject's first assignment into the experiment.
Pre-aggregating by date can reduce warehouse usage at the cost of some minor dilution to metrics. Specifically, all events that happen on the day of assignment will be included in the analysis, not just those after the subject is exposed to the experiment. For many use cases, this is a suitable tradeoff to make in order to drastically reduce warehouse costs.
Accounting for multiple entities
The approach above works well when you have a single entity (e.g., user). However, if you have multiple entities (e.g., user and visitor) you'll need to account for this in your pre-aggregated table. This can be done by simply adding a column for each entity. For example, consider a table of events tracked by user_id and visitor_id:
| user_id | visitor_id | event_type | timestamp |
|---|---|---|---|
| u_123 | v_123 | login | 2024-01-01 00:01:00 |
| u_123 | v_123 | search | 2024-01-01 00:01:15 |
| null | v_124 | login | 2024-01-03 00:02:00 |
| null | v_124 | search | 2024-01-04 00:02:20 |
| null | v_124 | search | 2024-01-04 00:02:40 |
| u_125 | v_125 | support_ticket | 2024-01-05 00:03:05 |
You can take the exact same approach as above but instead of only grouping by user_id, also group by visitor_id:
select
  user_id,
  visitor_id,
  event_type,
  date(timestamp) as date,
  count(*) as event_count
from user_events
group by 1, 2, 3, 4
Note that this is not the logic you'll enter into Eppo, but rather the logic you'll use in your data warehouse's transformation layer.
Moving beyond just event counts
So far this all works well if you only care about the count of events or unique subjects with a specific event. Often times however, you'll want to leverage additional event metadata such as time spent on page, minutes of a video watched, etc. In this case, your pre-aggregation will need to include some more complex logic. It's often helpful to pre-aggregate data in a set of tables each specific to a given surface area or set of events.
As an example, imagine you have a simple login page and want to track whether a login was successful. You might have data that looks like this:
| visitor_id | event_type | event_metadata | timestamp |
|---|---|---|---|
| 123 | login | {"success": true} | 2024-01-01 00:01:00 |
| 123 | login | {"success": false} | 2024-01-01 00:01:15 |
| 124 | login | {"success": true} | 2024-01-03 00:02:00 |
| 124 | login | {"success": false} | 2024-01-04 00:02:20 |
| 124 | login | {"success": false} | 2024-01-04 00:02:40 |
| 125 | login | {"success": true} | 2024-01-05 00:03:05 |
Simply aggregating this data by user and event type will not give you the information you need. Instead, you'll want to also leverage the event metadata. The resulting aggregated table might look like this:
| visitor_id | date | login_attempts | login_successes |
|---|---|---|---|
| 123 | 2024-01-01 | 2 | 1 |
| 124 | 2024-01-03 | 1 | 1 |
| 124 | 2024-01-04 | 2 | 0 |
| 125 | 2024-01-05 | 1 | 1 |
In your transformation layer, you'll need to extract the success field from the event metadata and then aggregate the data. This might look something like this:
select
  visitor_id,
  date(timestamp) as date,
  count(*) as login_attempts,
  sum(
    case
      when parse_json(event_metadata):success = 'true' then 1
      else 0
    end) as login_successes
from user_events
where event_type = 'login'
group by 1, 2
For events with a lot of properties (dimensions), you have two options: fan out each property value into a separate column, or include that property as an additional part of the group by statement. Properties like device type that are present for all events are typically better suited as an additional group by clause, whereas event-specific properties like "log in successful" are better to fan out into separate columns.
Depending on your use case, you may want to create one large table with all of your event types or you may want to group related events in separate tables.
By applying transformations on large data source like click stream tables, you can drastically reduce the amount of warehouse resources needed to run Eppo's data pipeline.
Configuring Eppo
In addition to passing in well-modeled data to Eppo, there are also decisions when configuring Eppo that can impact compute costs. This section talks through how to set up Eppo to ensure the pipeline is as efficient as possible.
Setting up properties
In order to provide rapid exploration of experiment results, Eppo will pre-compute dimensional breakouts of metrics. This is typically more efficient than computing breakouts live as we can leverage pipeline incrementality and only run the computation once instead of each time a user explores data. That said, it is worth being mindful of how many properties are added to the platform. If there are properties that teams never use, it is better to omit them from Eppo SQL definitions.
It is also worth limiting the number of dimensions with very high cardinality (number of possible values). Two common approaches are to bucket to a higher granularity (instead of country, use region) or to group all but the 10 most common values into an "other" bucket.
Finally, Eppo supports adding properties on both entities and facts. Fact properties should only be used when the property value is not one-to-one with the experiment subject (e.g., user). Common examples include product type, support ticket reason, etc.
Scheduling experiment refreshes
By default, Eppo will refresh results every 24 hours. If you have certain experiments that don't need daily results (for instance, long term marketing holdouts), consider adding a custom schedule. Eppo's incremental pipeline will automatically adjust to only scan data since the last scheduled run.
Leveraging partitioning
Eppo never runs SQL definitions directly but rather uses them to compile a data pipeline that runs in your warehouse. Every query will be wrapped in a date filter to ensure Eppo only scans recent data:
select ...
  from (
    {{ your SQL definition}}
  )
 where {{selected timestamp column}} > current_date - 2
(A 2 day lookback is the default, your Eppo Support Engineer can configure a custom look back if desired)
If the event timestamp is the partition key, this naturally leads to efficient scans of your data. However, if the table is partitioned on a different column (for instance, event date), some SQL compilers will still scan the full table.
If you'd like to specify a separate column to use in filtering, you can add an optional "Partition Date" column on the SQL definition:
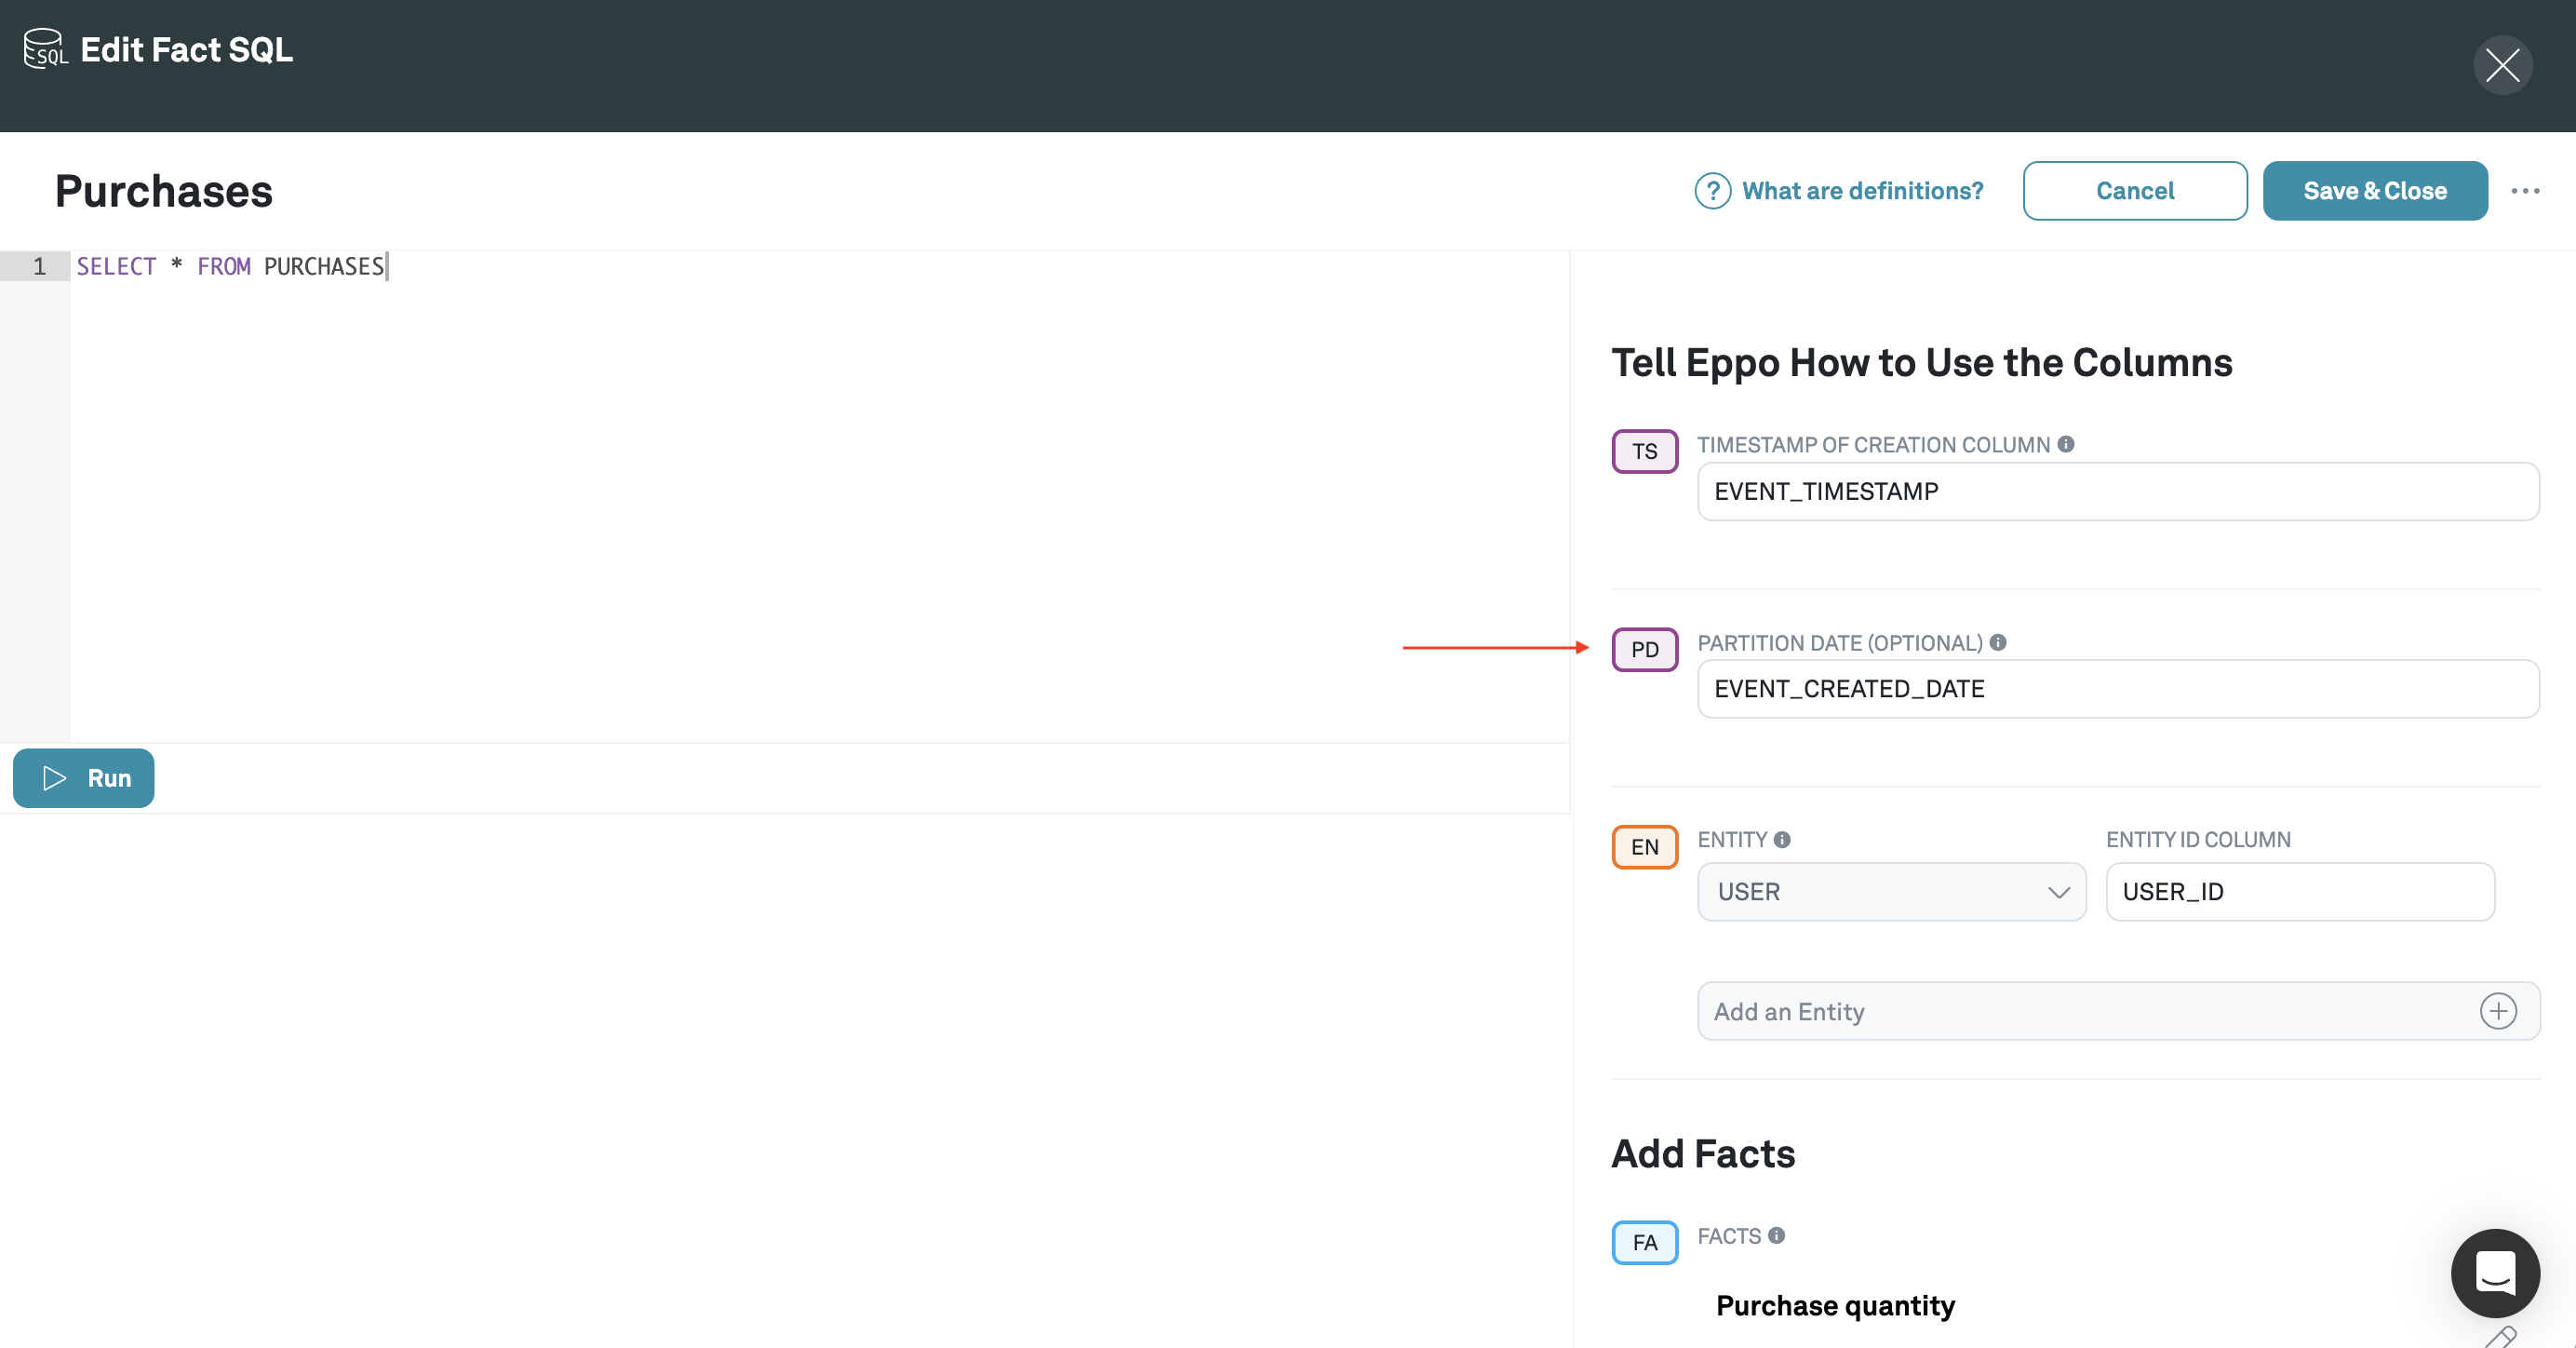
Partition dates are disabled by default, if you'd like to enable them in your workspace, please reach out to your Eppo representative or email us at support@geteppo.com.
Monitoring
Identifying problematic sources
When an experiment refresh fails or times out, Eppo will automatically run diagnostics against the fact sources connected to the experiment to help identify poorly configured sources.
Your Eppo support team can provide a custom dashboard showing how long each source is taking to compute. This naturally highlights specific sources that either contain complex logic or do not fully leverage partitioning.
Setting up notifications
Finally, you can subscribe to Slack notifications for any time a data pipeline fails. If a SQL source is poorly configured, or an underlying data model changes, these notifications can help guarantee that the pipeline runs smoothly and within the timeout parameters configured within your data warehouse.