Copy SQL
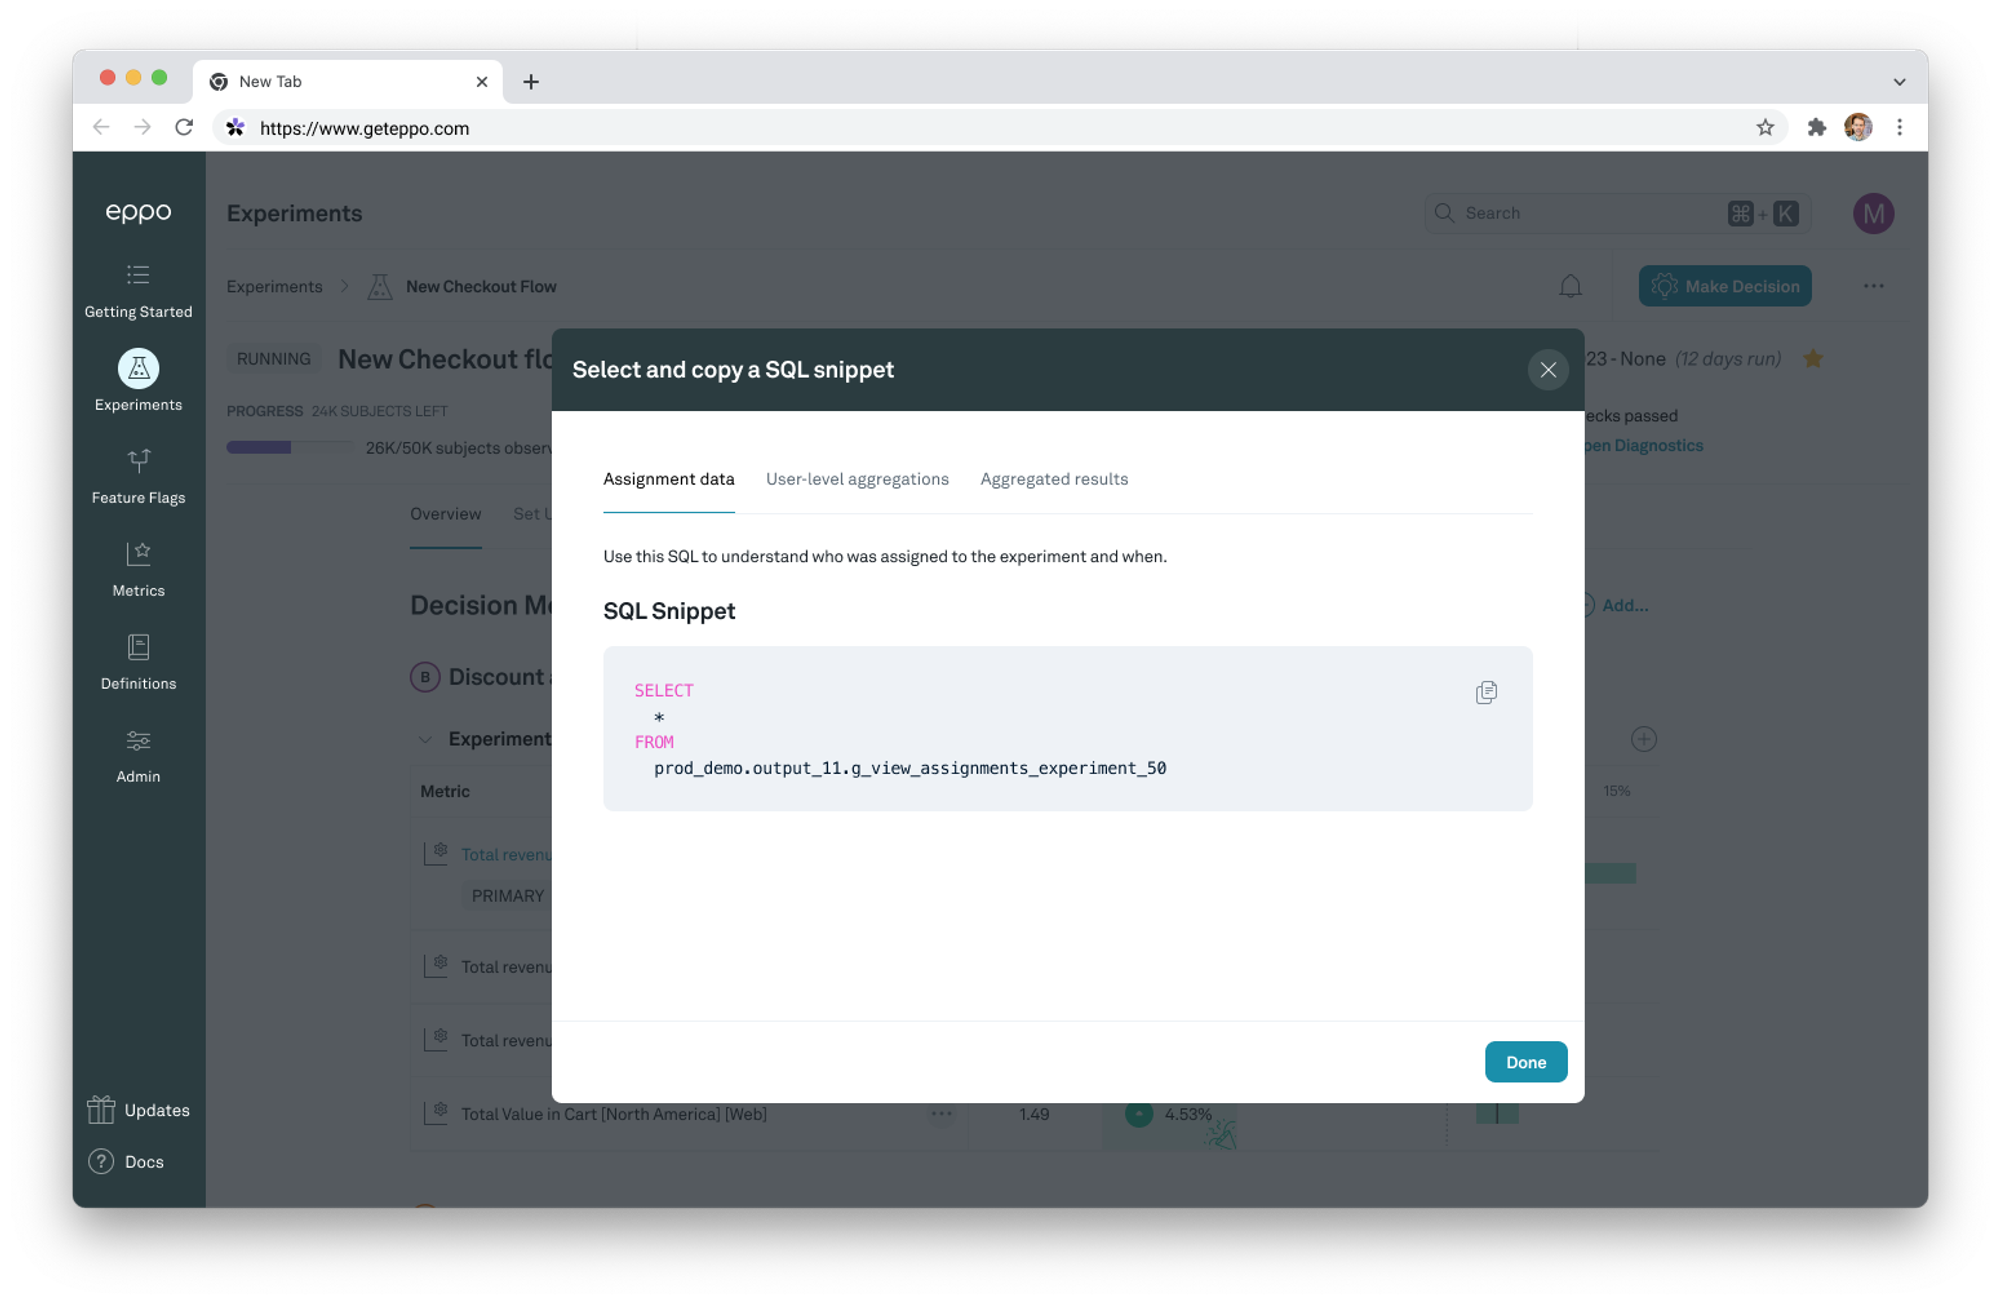
Eppo’s “Copy SQL” button provides SQL snippets to use for every intermediate table Eppo writes to your warehouse. Eppo can do this because we are a fully warehouse-native application.
Once you click the Copy SQL button on a metric in an experiment, you can choose from three options for viewing the data: assignment data, user-level aggregations, and aggregated results.
This makes it easy to:
- Reconcile any manual analysis against Eppo
- Examine individual subjects’ performance in an experiment
- Conduct bespoke analyses that aren’t available in Eppo, such as cluster-level analysis, with your favorite query tool like Hex or Looker
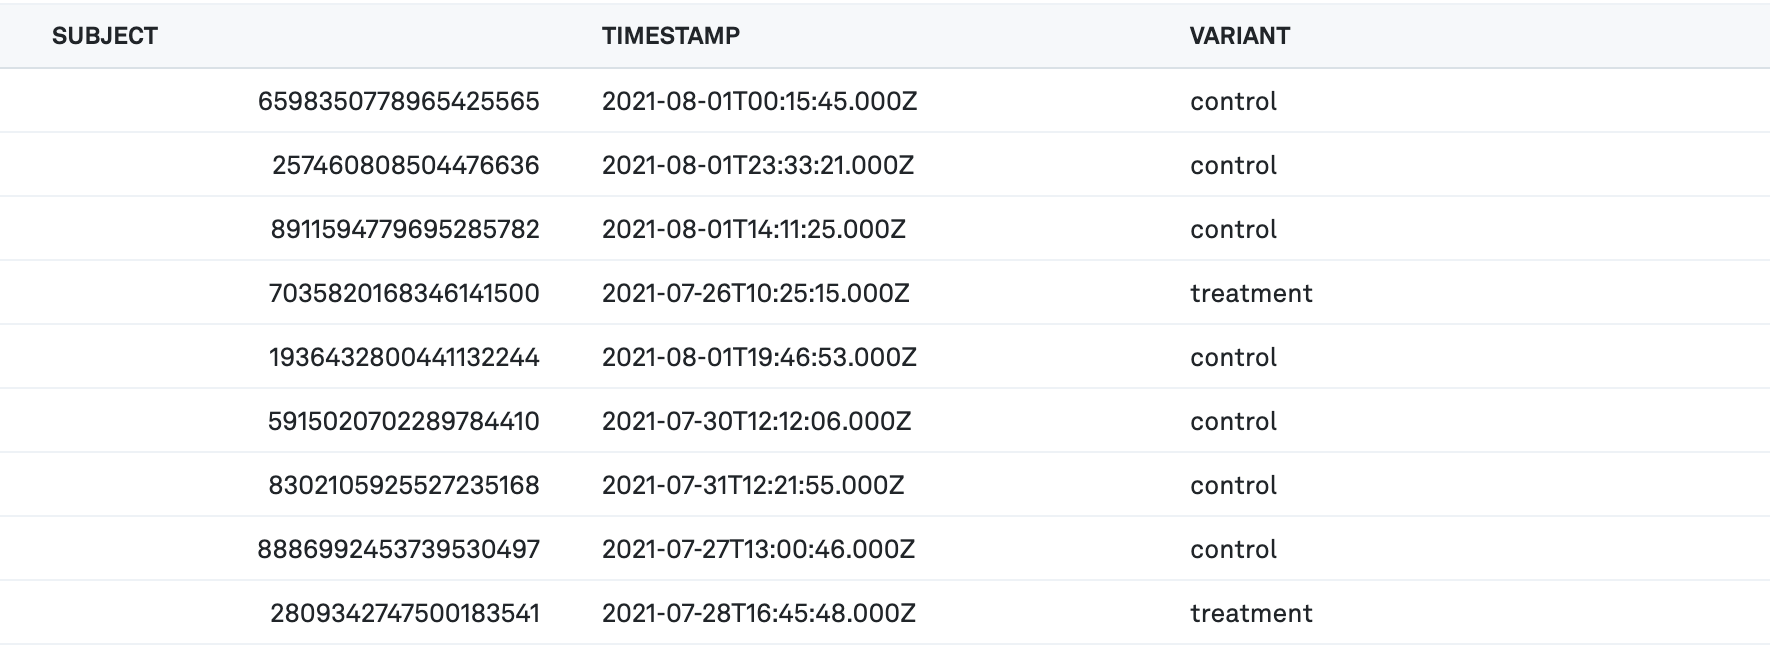
Assignment data
With the assignment data you can see exactly which subjects were in each treatment group, including who was thrown out of the analyses due to cross-device contamination. This can be helpful when matching your manual analysis to Eppo, or for seeing how experiments intermingle with other projects (like marketing campaigns).
Columns:
- Subject - IDs of the entities assigned to the experiment
- Timestamp - timestamp of assignment into the experiment
- Variant - variant the entity is assigned to
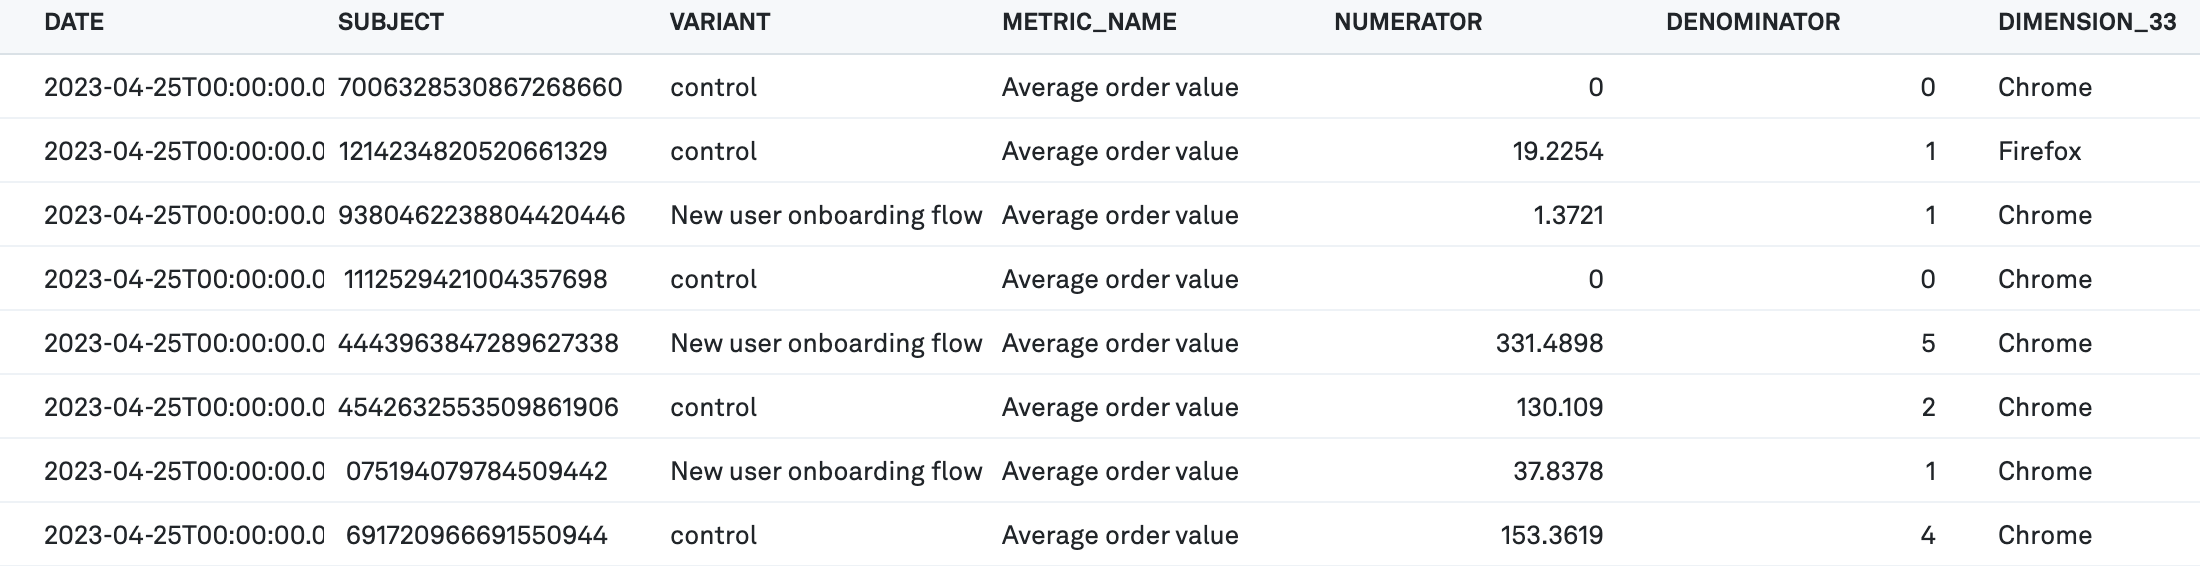
User-level aggregations
User-level aggregation allow you run custom analyses. For example, you can check how different quantiles vary across treatment and control. Or you can put the datasets into a regression to do your own CUPED variance reduction analysis.
Note that the table is indexed on date and entity id. This gives you the daily cumulative results for each entity.
Columns:
- Date - The date of experiment analysis, starting at the assignment date for the entity
- Subject - IDs of the entities assigned to the experiment
- Variant - variant the entity is assigned to
- Metric_name - name of metric being explored
- Numerator - numerator of metric aggregation
- Denominator - denominator of metric aggregation when the metric is a ratio metric
- Dimensions - Entity dimension values for the entity
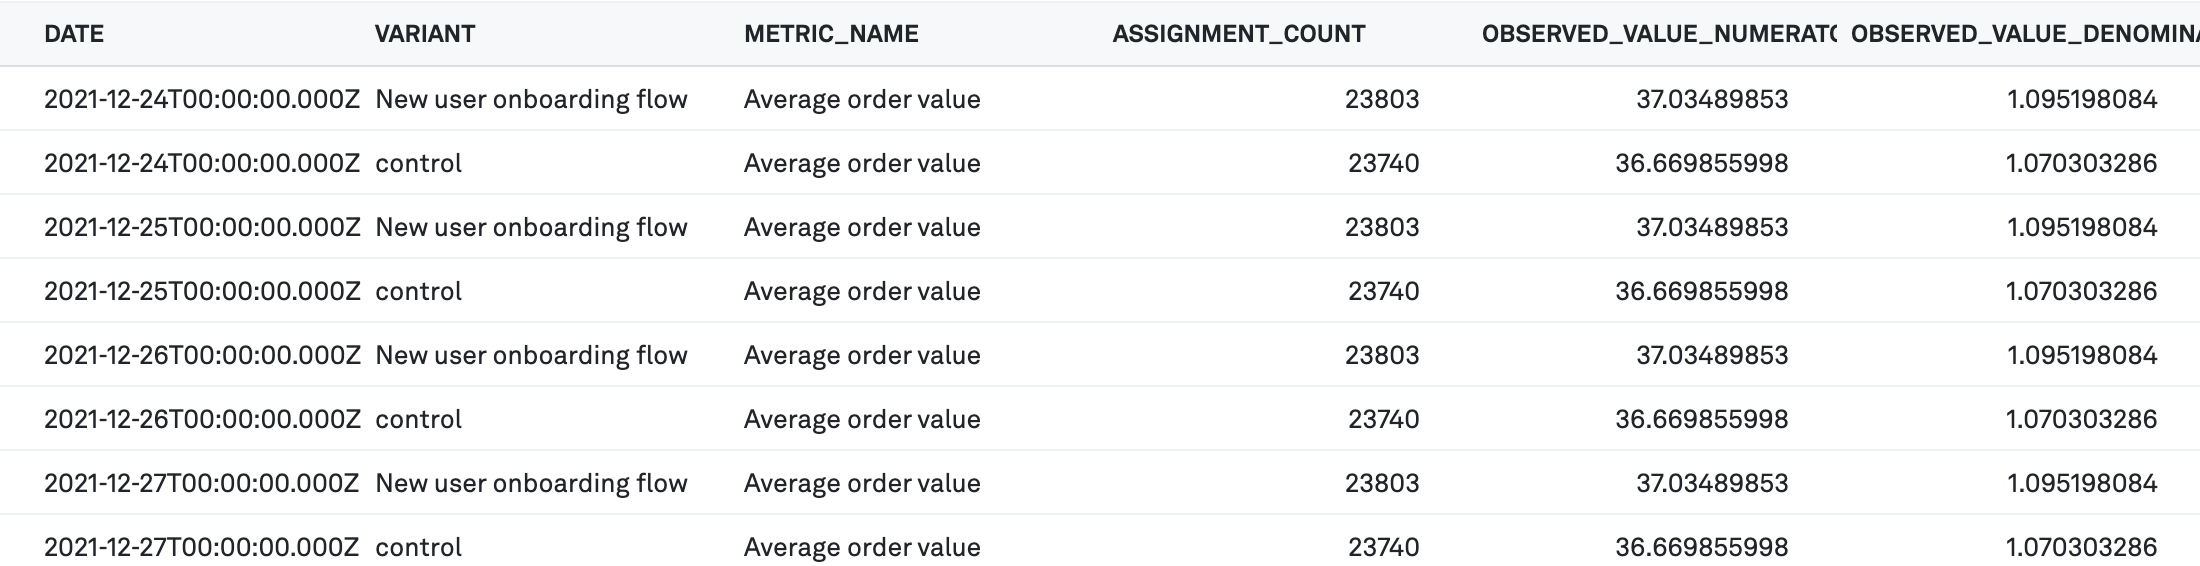
Aggregated results
Aggregated results give you access to daily values for each metric, allowing you to visualize experiment results as you want.
Note that the table is indexed on date and variant. This gives you the daily cumulative results for each variant.
Columns:
- Date - The date of experiment analysis, starting at the experiment analysis start date
- Variant - variant the entity is assigned to
- Metric_name - name of metric being explored
- Assignment_count - the number of entities assigned to the variant on the date
- Observed_value_numerator - aggregated numerator value for the variant on the date
- Observed_value_Denominator - aggregated denominator value for the variant on the date if the metric is a ratio metric