Data Pipeline
The Eppo data pipeline is a directed acyclic graph (DAG) of tasks that run within your data warehouse to power Eppo's UI. Only data from the final stage of the pipeline (anonymized experiment aggregates) is egressed into Eppo's backend.
Experiment pipeline
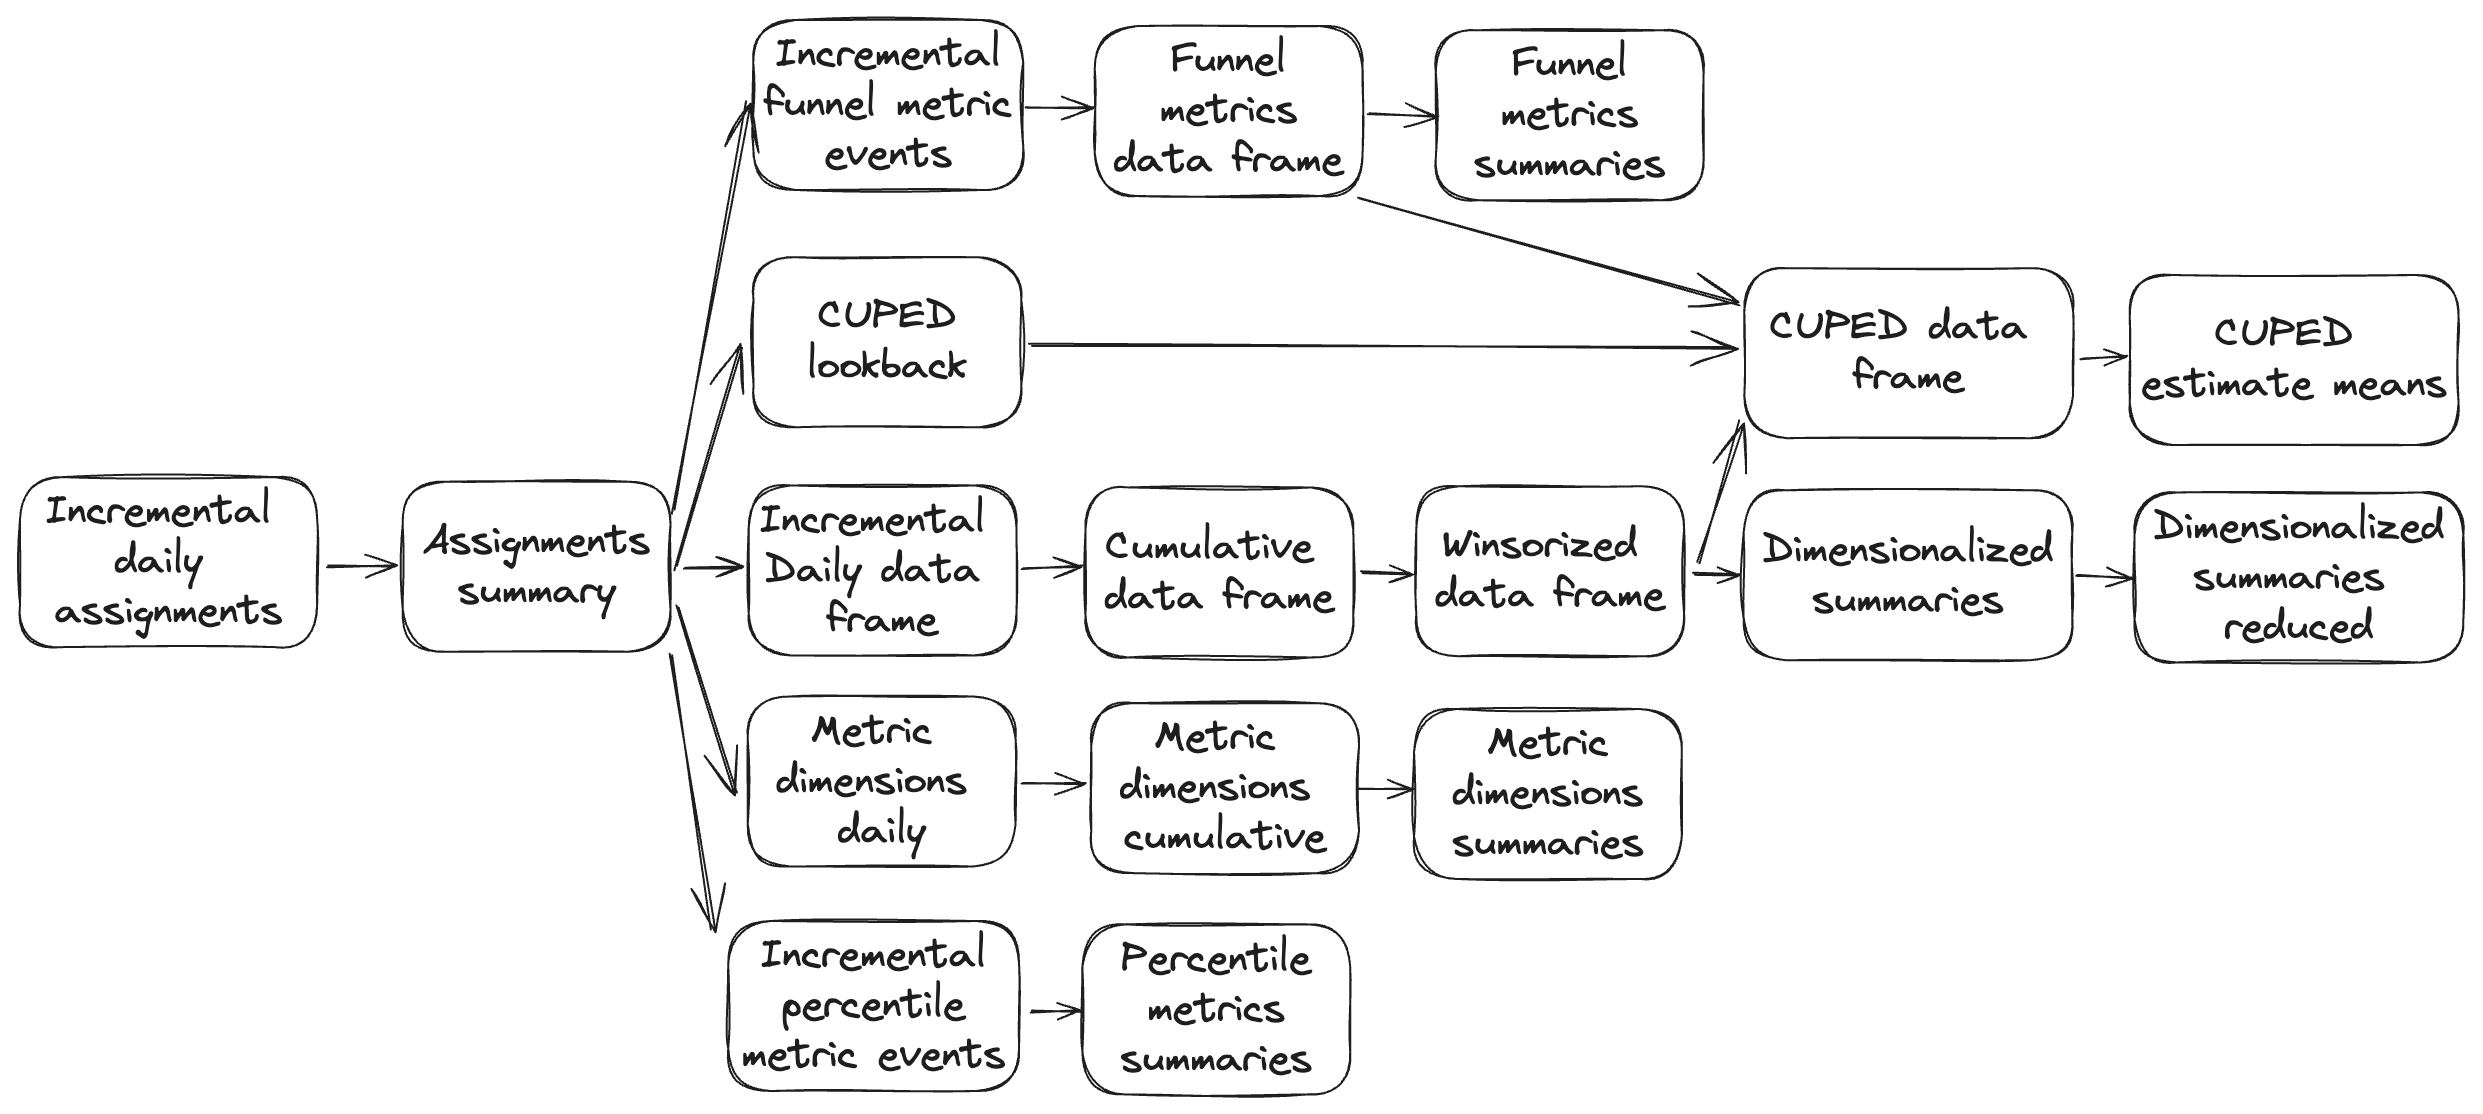
At a high level, the Eppo experiment data pipeline has four main branches along with an assignment summarization that is a predecessor for each of those branches.
- Assignment summarization
- Core pipeline
- CUPED pipeline
- Metric dimensions/properties pipeline
- Funnel metrics pipeline
Monitoring pipeline performance
To see how compute resources are used across the different sections of the experiment pipeline, navigate to the Warehouse tab on the left navbar. Here you can see a recent trend of pipeline runtime by section:
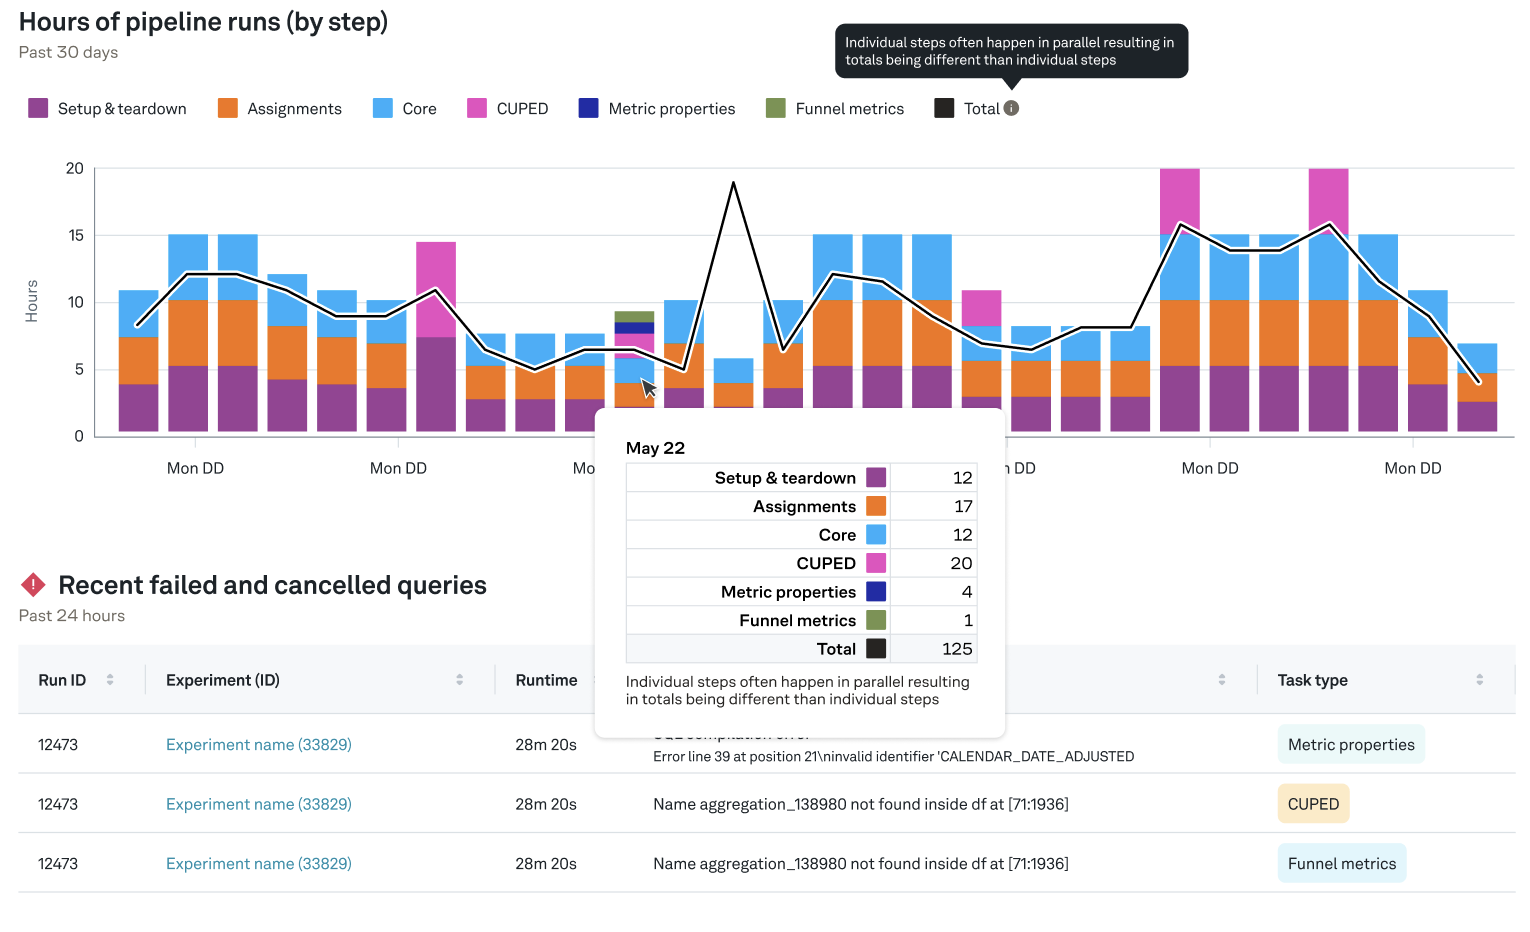
Note that the y axis shows the compute time accrued by that task type. That is, if two queries run at the same time for 5 minutes, that would contribute 10 minutes to the y axis.
Incremental refreshes
Eppo's scheduled jobs will run an incremental refresh that only scans recent data. By default, this lookback window will include data starting 48 hours before the last successful run (to change this time window, reach out to your Eppo contact or email support@geteppo.com). New metrics and metrics/facts with an updated definition will automatically be backfilled from the start of the experiment. Further, if a job fails on a given day, the next scheduled job will automatically go back and re-run metrics for that day.
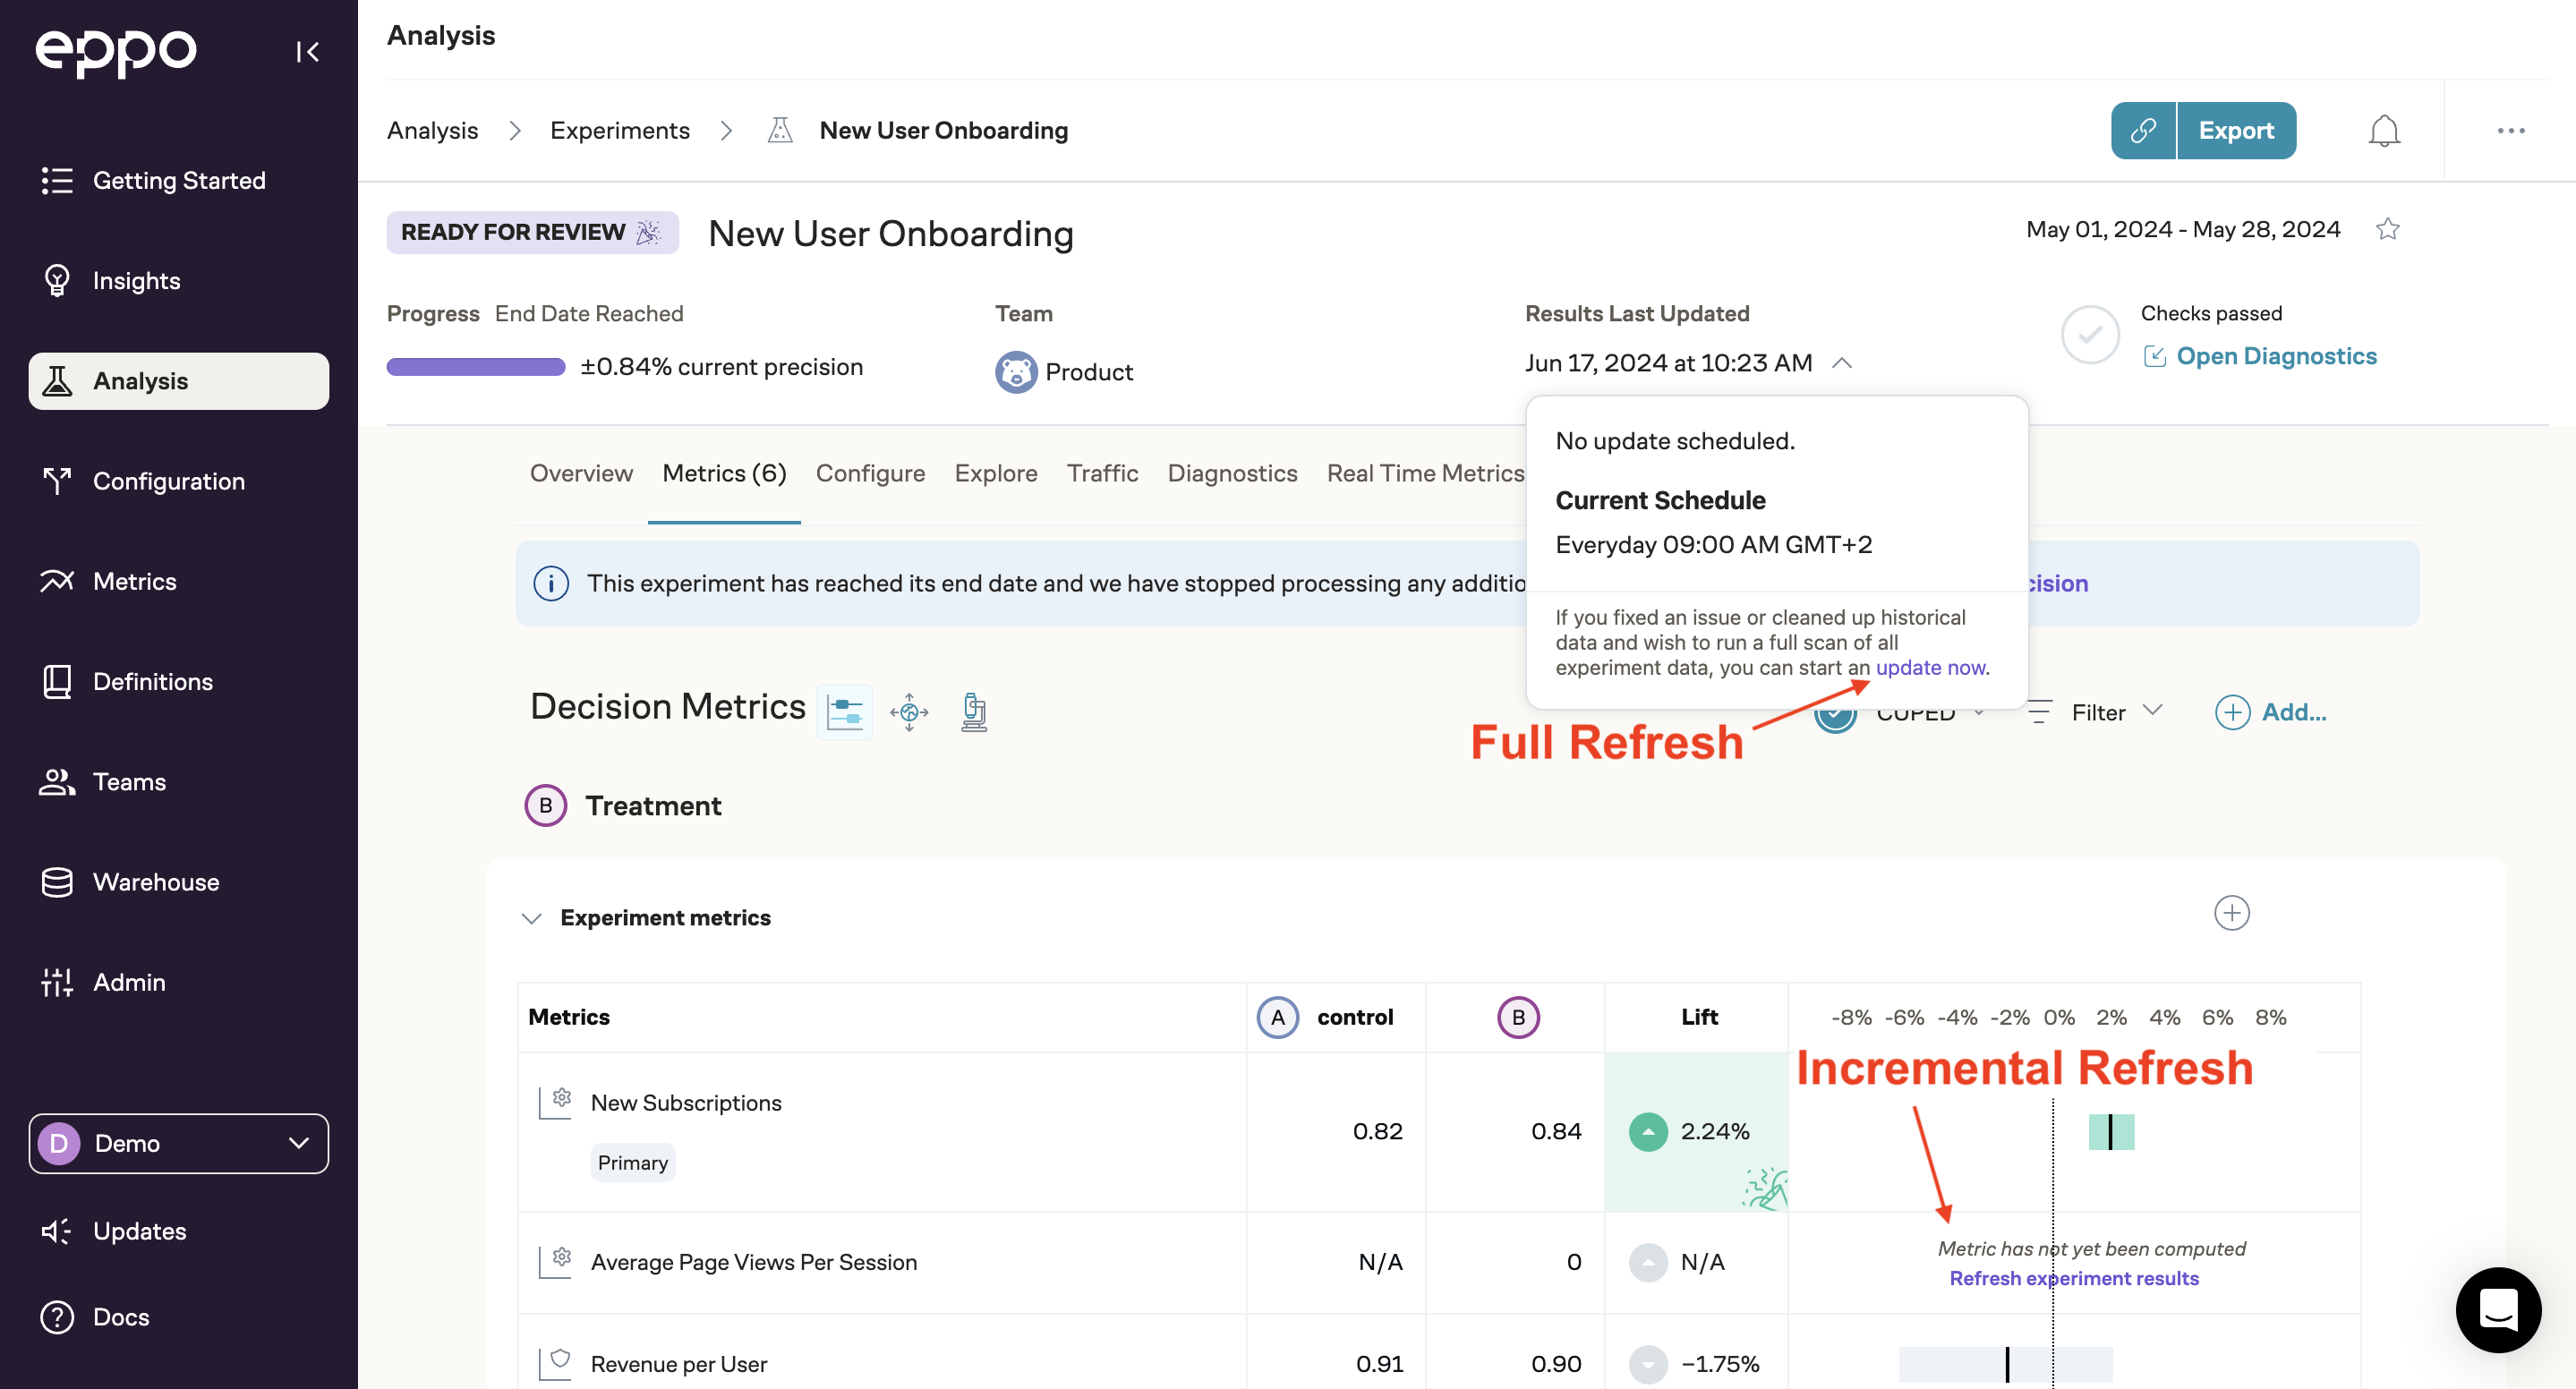
You can also trigger a refresh in the UI by clicking "refresh experiment results" on the metric scorecard. This will compute new metrics from scratch and update existing metrics based on the incremental logic described above. If you'd instead like to force a full refresh and recompute all metrics from the start of the experiment, click "update now" under "results last updated".
Pipeline steps
Assignment summarization
- Incremental daily assignments: As part of the incremental process, we first delete the last two days worth of data. We then select all assignments from the past two days for this experiment and insert them into a daily table, recording the first variant, assigned timestamp, and whether or not a subject was exposed to more than one variant for each day.
- Assignments summary: We recompute the assignment summary from scratch each run. There's one record for every subject, including the observed variant, timestamp of assignment, and whether or not they were exposed to multiple variants. This table is used downstream by all four pipeline branches.
Any subject that was exposed to more than one variant over the course of the experiment is excluded from the experiment analysis.
Core Pipeline
The core pipeline starts with the assignments, incrementally joins event data from your metrics/facts, aggregates the data, and computes winsorized aggregates.
- Incremental daily data frame: We join your experiment assignments to your fact sources. We use a "wide" table format where every metric aggregation is a separate column. As part of the incremental process, we first delete two days of data before re-inserting it. This is to ensure if there's time-delayed data it's updated appropriately.
- Cumulative data frame: We aggregate the daily data to generate a timeline view of all metric data for each subject.
- Winsorized data frame: We apply winsorization according to the cumulative data frame based on your metric settings.
- Dimensionalized summaries: We convert our subject-level winsorized data frame to an overall summary with dimensional values included.
- Dimensionalized summaries reduced: For high cardinality dimensions, we cap dimension values to 50 (by assignment volume) to minimize the data we transfer to our operational Postgres database.
CUPED pipeline
- CUPED lookback: We summarize the prior 30-days of data for each subject for each metric.
- CUPED dataframe: We join the last day of data from the winsorized data frame from the core pipeline to the lookback data to create a unified CUPED data frame.
- CUPED estimate means: Our regression engine runs in your warehouse and estimates the lift for each metric.
Metric dimensions/properties pipeline
We compute metric dimension (also called metric properties) metric values as part of our pipeline to enable exploration by metric dimensions.
- Metric dimensions daily: An incremental step, very similar to the core pipeline daily data frame step. Every metric dimension value is treated as a separate metric with its own column. If you have high cardinality along several dimensions, this can make this step fairly slow (though we do cap cardinality at 50 to guard against this).
- Metric dimensions cumulative: Very similar to the cumulative data frame step from the core pipeline, we generate summarized metric dimension values for each subject and day.
The top 50 values are computed in a weekly job (and immediately after saving) that scans the fact SQL for the past month and sorts by the highest volume.
Funnel metrics pipeline
Funnel metrics require their own pipeline because of the complicated logic that must be performed over the relevant events.
- Incremental funnel metric events: We incrementally join assignment data to the event sources for your funnel metrics.
- Funnel metrics data frame: We generate a data frame for each subject and day for each funnel metric.
- Funnel metrics summaries: We summarize the values for your funnel metrics.
Privacy
As we’ve detailed, Eppo doesn’t export individual data from your warehouse. We actively minimize what information we store.
- Fact creation: We query small sample of tables to help you set-up and make sure the column names and types match. We do not send those results beyond your analysts’ browser nor do we retain them; we just store the configuration. We can anonymize that step by only showing the data type, not the exact value. We do not need access, and encourage you not to give our service account access to any personally identifiable information (PII), just unique identifiers that you have generated.
- Incremental pipelines: Our pipelines query daily aggregate of assignments and facts, we only store those on your warehouse. We only keep a copy of the text of the queries that we generate and run (where table and column names appear, but no individual information). We do not keep individual outputs for any daily query. We add them up into incremental tables and store those in your warehouse too.
- Auditability: Our queries and the resulting tables are fully auditable by your data engineers. Our process rely on a service account whose access you control and can revoke at any time. Your engineers configure the service account connection via our web app with no intermediaries. We store the credentials directly into Google Secret Manager. You can update credentials on your own if needed.
- Monitoring: We keep the interactions between your collaborators with our service in our database: feature flag configuration, when they were changed, who ran queries to set facts, assignments or properties, when an experiment was configured, etc.
- Caching results: We copy and cache overall results (latest incremental totals, metric patterns) to make our interface snappy. This is any total that you can see on our service: total number of assignments, total number of conversions, total amounts. For ratios, we store the numerator and denominator (for incrementality).
If you have any question about our privacy practices, please reach out.
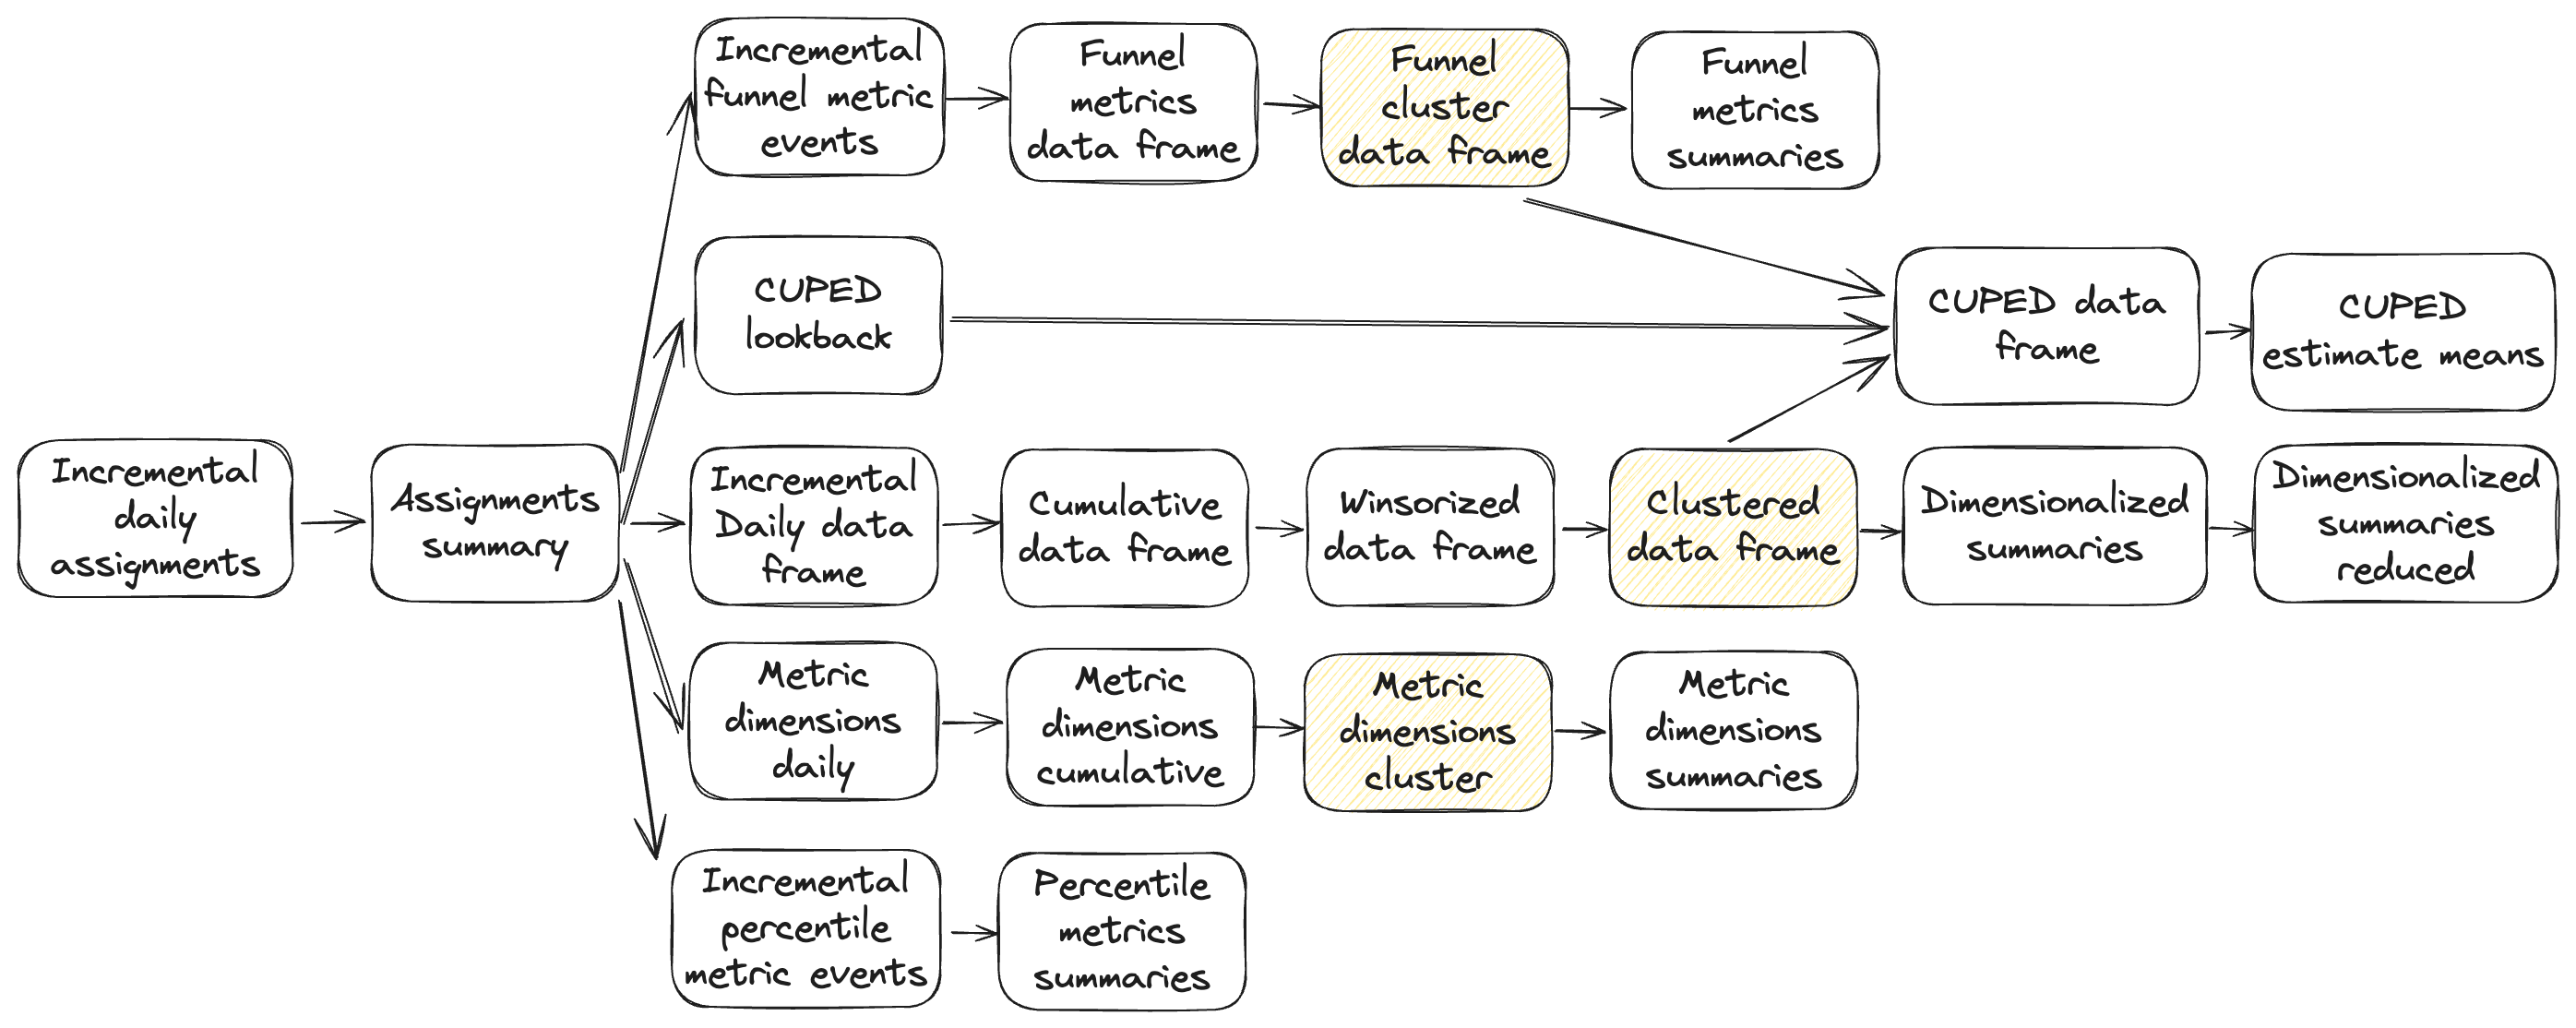
Clustered Analysis Pipeline
Clustered analysis experiments have a few more steps in the data pipeline to aggregate from the subentity level to the cluster level. See diagram below with additional steps highlighted.