Property analysis
The experimentation process involves an analysis period where every stakeholder is hungry for answers for why an experiment succeeded or failed. This process usually relies on experts, typically in Data Science, to check the right dimensions and find those answers. For example, a key metric like purchase conversion might be positive, but could it have unexamined downside on a key segment?
Property Analysis allows for the junior engineer to proactively see that it had an outsized negative effect on new users, or users on iPhones, or Chinese users. The need for an expert is now removed, saving timing, surfacing insights, and resulting in better learnings.
Using property analysis
In the Explore tab of an experiment, Eppo automatically surfaces anomalies in the behavior of specific user groups. This variation in behavior of different groups (also called heterogenous treatment effects) can provide information on how groups interact with specific experiment variants.
Due to the large amount of comparisons presented, it's possible for false positives to occur. Accordingly, we recommend that Property Analysis is used to form future hypotheses, not inform rollout decisions.
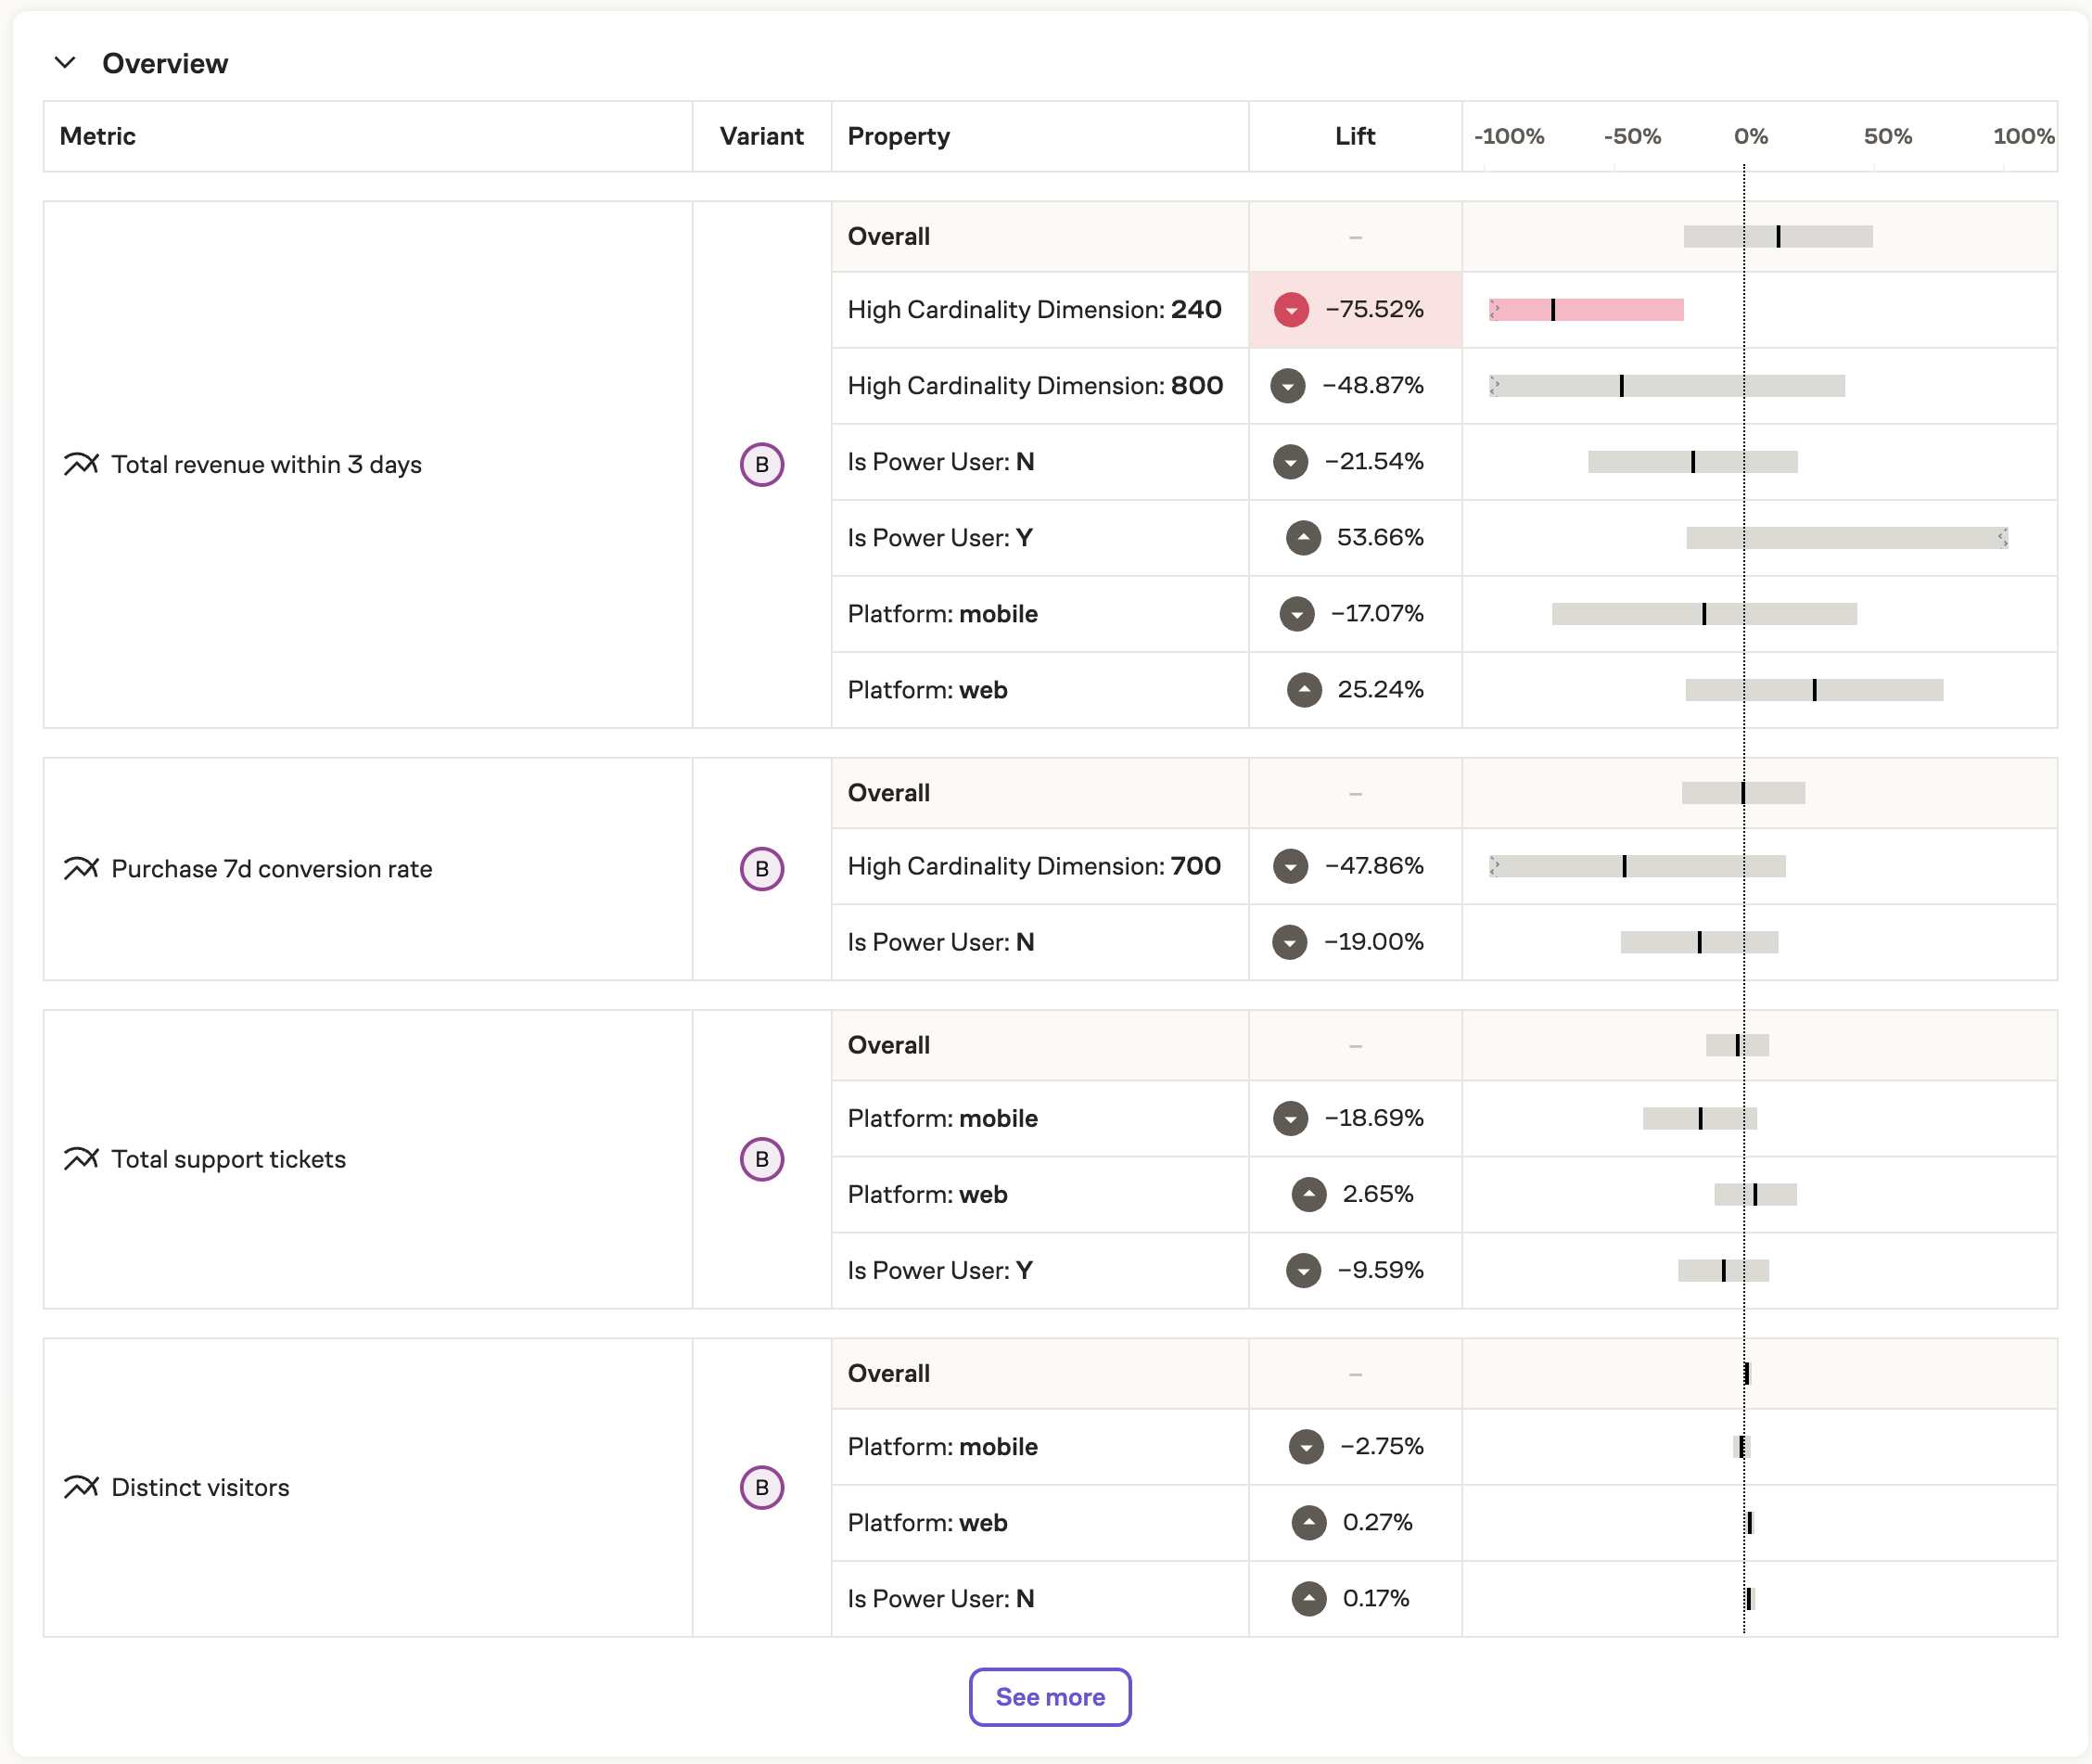
Overview
The Property Analysis overview surfaces the top entity properties per metric with large differences versus the overall metric value. We choose top properties per metric by comparing the absolute value of the difference between the property value confidence interval and the overall confidence interval for each metric.

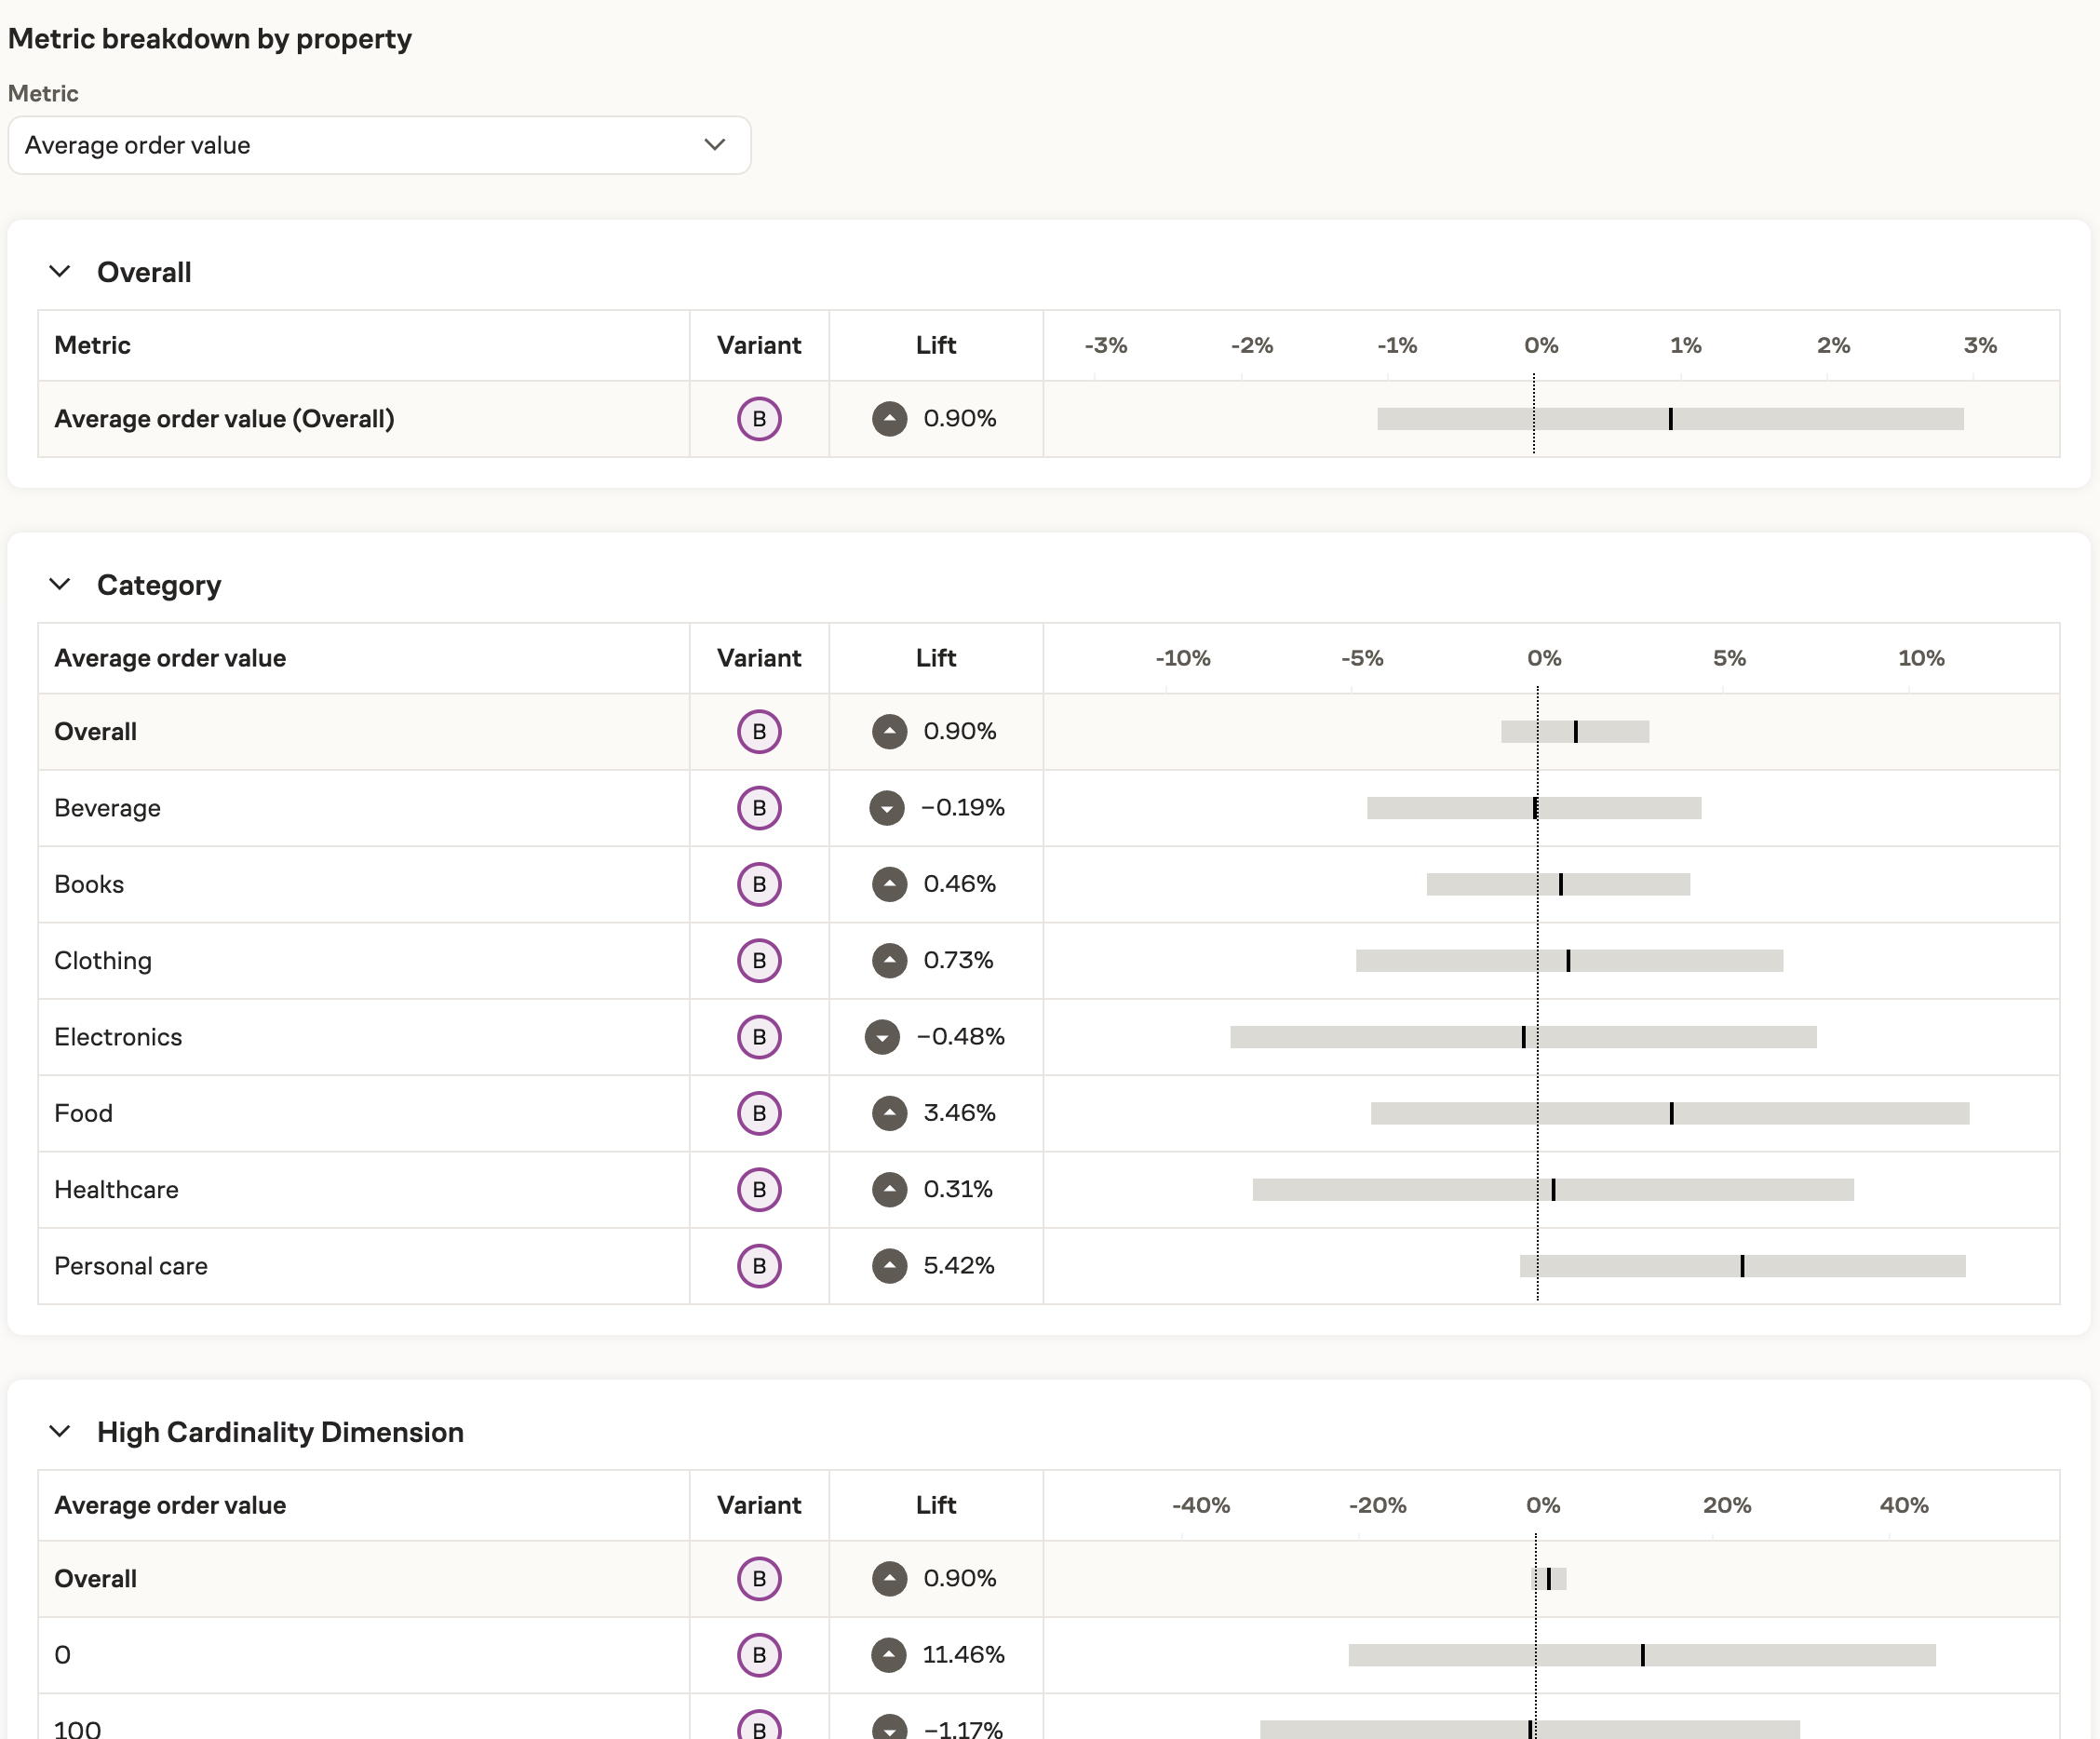
Metric breakdown by property
You can dive deep into how all property values perform for any given metric. This view let's you peruse a given metric at a glance to pick out any highlights to explore further. To use this view, simply pick a metric in the Metric breakdown by property section of the Explore page.
