CUPED++
The precision of experiment results (the width of confidence intervals) depends on the variance of the metrics we are measuring. One way to improve the precision of experiments is to gather more data, as the variance goes down as we gather more data; this obviously means that it takes longer to run an experiment.
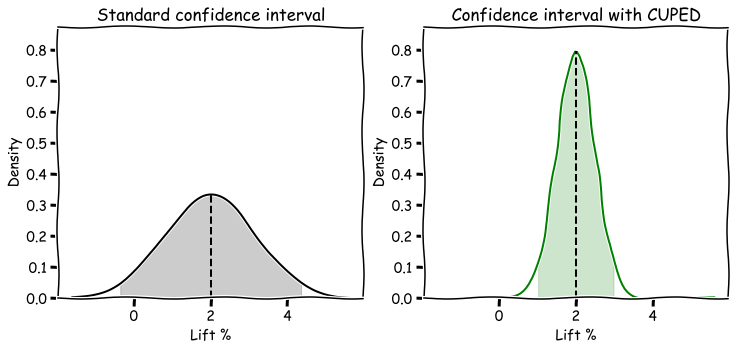
However, there are options beyond waiting to gather more data, and all these options address reducing the variance in the metrics we are measuring directly. One particularly flexible and powerful method is known as CUPED. Standard experiment analysis involves comparing metric data from subjects exposed to a treatment to that of a control group -- all the data is gathered during the experiment. But most companies know something about their users beyond what they did during the experiment, most prominently metric data from before the experiment started. CUPED leverages this data from outside the experiment in order to control for some of the variance in metrics that comes from randomly picking variants for each subject; in a standard experiment, you might end up with one variant having more active users just by random chance, while CUPED reduces the effect of this random variation by controlling for the different activity levels across different variants. You can think of CUPED as a pair of noise cancelling headphones: it uses data gathered prior to the experiment to understand the ambient noise, allowing you to notice a more pronounced pattern in the data.

The above sketch illustrates how CUPED helps reduce the variance in an effect estimate, leading to a much tighter confidence interval.
Since CUPED models are computationally intensive, we only use CUPED to reduce variance on the metrics overview page. In particular, there are no CUPED estimates for:
- filtered results (including segments)
- explores
Data
When CUPED is enabled, Eppo automatically ingests aggregated data about each subjects in the following ways:
- For each (applicable) experiment metric, we look at the pre-experiment values during a lookback window. The window is 30 days by default. It ends on the moment each subject is being assigned (or passes an Entry point).
- Furthermore, we also leverage the assignment properties for the subject (e.g. country, browser, etc.)
As a concrete example, consider an e-commerce website that runs an experiment with 3 metrics:
- total order value (sum of price),
- number of orders (count of price), and
- 7-day purchase conversion.
Furthermore, the assignment table has an assignment property indicating the user's country. In this case, our CUPED++ model uses historical data on order value, number of orders, and user country. It does not use historical data on 7-day purchase conversion since it does not have a clear pre-experiment analog.
Think of the above as the matrix in a regression; in fact, we will re-use this X to improve estimates for each experiment metric.
Model
For each of the metrics in the experiment, we now regress the outcome on the covariates as defined above using a ridge regression, separately for each variation. We can then use the predictions of these models to improve the effect estimates, with the variance of these estimates being proportional to the mean square error of the predictions. Thus, the improvement in the confidence intervals is directly related to how well the pre-experiment data can predict experiment outcomes.
CUPED works best for experiments with long-time users for whom many pre-experiment data points exist. It is generally less effective for newer users; if you are running an experiment on a change in the onboarding flow for new users, there is no prior data to leverage, just the assignment dimensions, and hence there is less benefit. However, one appealing characteristic of our approach that you do not have to worry about CUPED giving you worse results. In the worst case scenario, it does equally well as the standard approach.
What makes Eppo's CUPED++ different
In general, CUPED refers to reducing the variance of a metric by using pre-experiment data on only that metric itself based on the covariance between the two; this is equivalent to running a simple regression. This is often the most important variable in a regression, but does suffer some drawbacks:
- For some metrics, there is no clear pre-experiment equivalent for that metric: e.g. a conversion or retention metric. In our implementation, we can still leverage historical data of the other experiment metrics to help improve estimates of these conversion and retention metrics. This allows us to get improved estimates for conversion and retention metrics versus a standard CUPED approach.
- The standard CUPED approach does not help for experiments where no pre-experiment data exists (e.g. experiments on new users, such as onboarding flows). Because we also use assignment properties as covariates in the regression adjustments model, we are able to reduce variance for these experiments as well, which leads to smaller confidence intervals for such experiments.
CUPED++ and stratified sampling
Eppo's CUPED++ provides the statistical benefits of stratified sampling in a powerful and performant way.
Stratified sampling is a common technique used in classical experiment designs (clinical trials, social science experiments, etc.). It helps guarantee that the treatment and control groups have a similar mix of important factors, like medical history or demographics. This can lead to tighter confidence intervals and more sensitive experiments.
However, using stratified sampling in online systems is less common in practice. It often introduces substantial engineering overhead and can lead to performance issues. Other methods, like seed finding, also have problems — especially when dealing with new users.
Eppo's CUPED++ model offers a better solution. It provides the same statistical benefits as stratification but without the extra engineering effort or performance issues. This approach, called post-hoc stratification, lets you balance groups after the experiment instead of during assignment. You just need to include the important categories as assignment properties, and you’ll get the same variance reduction as traditional stratification. Plus, you can use as many variables as you want, even if they weren’t available at the time of assignment.
For more details, check out section 3.3 and Appendix A of this Microsoft paper. Netflix has also studied the pros and cons of real-time stratification versus post-hoc adjustments like Eppo’s CUPED++. They also recommend post-hoc adjustments over real-time stratification.
Using CUPED on Eppo
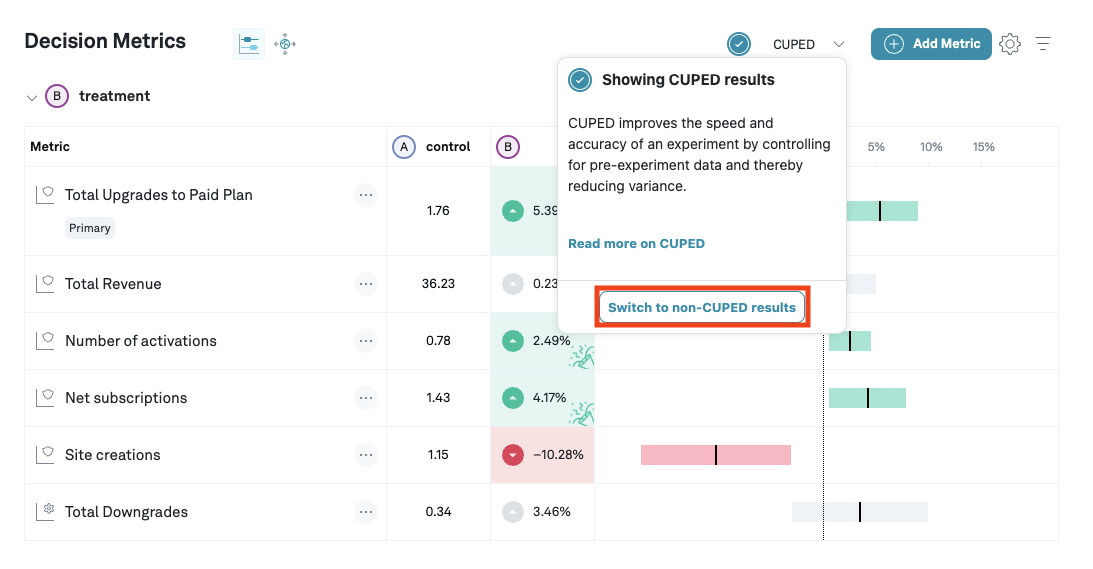
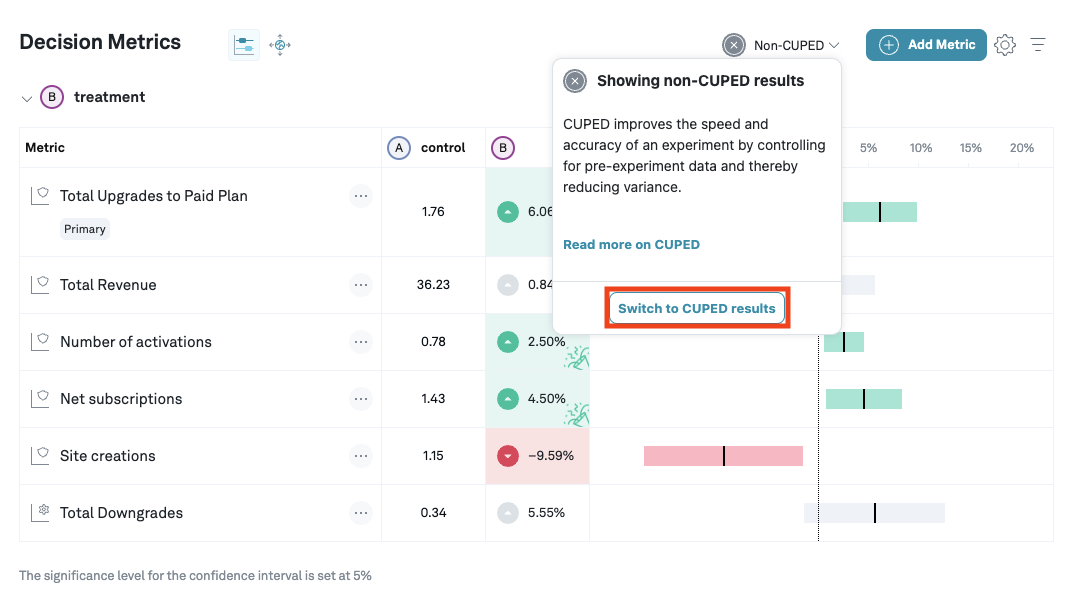
You can switch between CUPED and non-CUPED results from the CUPED dropdown.


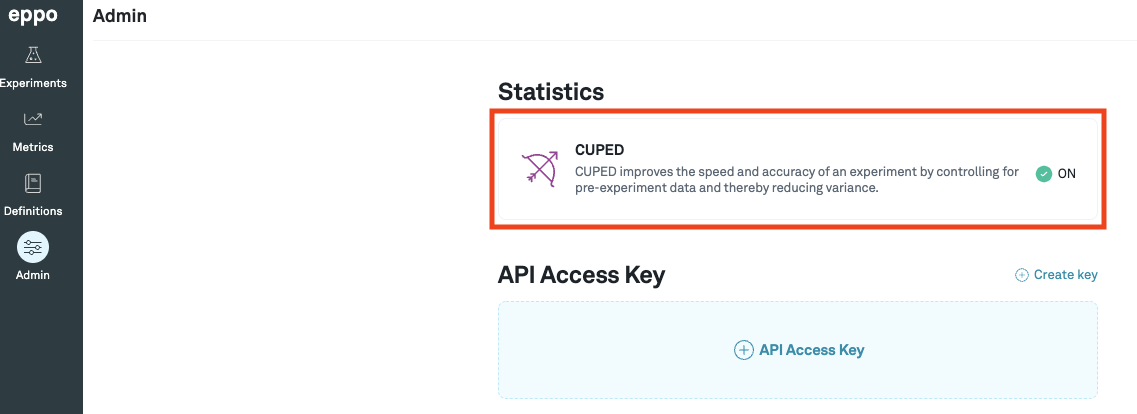
CUPED can be turned on in the admin panel, and in the overview page of an experiment you can switch between CUPED and standard estimates. The models are updated once a day, but you can manually refresh upon changing the control variant or adding a new metric.

Frequently asked questions
What data does CUPED use?
- Pre-experiment data from all eligible metrics (sum, count, unique entities, and these aggregations for ratio metrics)
- Assignment properties from the AssignmentSQL used for this experiment. These are interpreted as categorical features. Currently, we include assignment properties that have 100 or fewer values.
To avoid confusion, it is useful to keep in mind that the above refers to the input data. CUPED produces improved results across all metrics.
Does CUPED apply to all metrics? Yes, our CUPED implementation works to improve the precision for any metric type (standard, ratio, funnel, percentile). However, not every metric is used as covariate, the pre-experiment totals used as input to CUPED:
- Retention or conversion metrics, and more generally metrics filtered by timeframes are not selected as covariates;
- Neither are metrics with subject filters, notably time-based metrics that users “age into”;
- Nor are Threshold metrics. We might also exclude metrics based on definitions with large data volume, to avoid querying your data warehouse beyond reason. The only requirement for CUPED is that the experiment has eligible metrics and/or assignment properties configured (see previous question). If so, CUPED is applied across all metrics (even those that are not eligible as input to CUPED).
Why do the point estimates between CUPED and non-CUPED look different? CUPED and non-CUPED estimators are both unbiased (given proper randomization) of the same quantity, so we would expect estimates to be close. However, they are generally not the same -- if they were, then how would CUPED be able to reduce variance? This in particular can be somewhat confusing when one of the estimates is positive, while the other is negative.
In general, as long as the estimates are close, this is nothing to worry about. Obviously, it is important to understand what "close" is? How close these two estimators are to each other depends on the variance of the estimates. In general, we expect the point estimate of the CUPED estimator to lie within the confidence interval of the non-CUPED interval. Thus, when the non-CUPED confidence interval is very wide, the two point estimates can look quite different.
On the other hand, when there is no overlap between confidence intervals, then it suggests there is indeed a problem. The two most common problems are:
- There is a traffic imbalance, which invalidates both CUPED and non-CUPED results.
- Pre-experiment data is tainted, for example because some users were exposed to the treatment before the experiment analysis has started. In this case, the CUPED results are no longer valid, but non-CUPED results still are.
Do not hesitate to reach out to help you understand the discrepancy.
Further reading
The statistics behind CUPED quickly get quite involved. For more details, please see