Sample Ratio Mismatch
Validity of experimental results crucially relies on proper randomization of subjects. The traffic tab shows how many subjects are randomized into the experiment, and how they are divided across variants. Furthermore, we use the sample ratio mismatch test to verify that subjects are divided across variants as expected.
Diagnostics
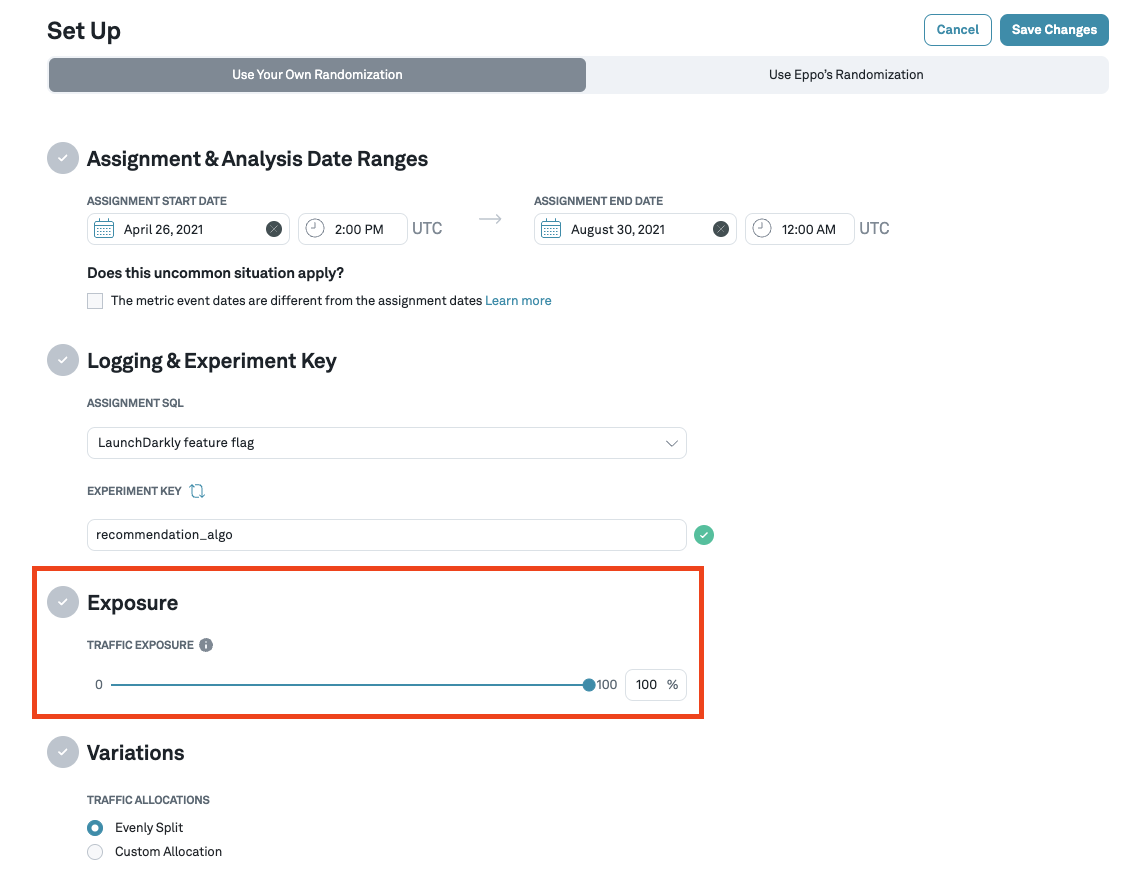
To check traffic diagnostics, navigate to the Experiments page by clicking on the Experiments icon from the left tab and then from the list, click on the experiment that you are interested in. The details page for each experiment contains a Set Up tab where you can configure the % of traffic you want to randomize into the experiment.

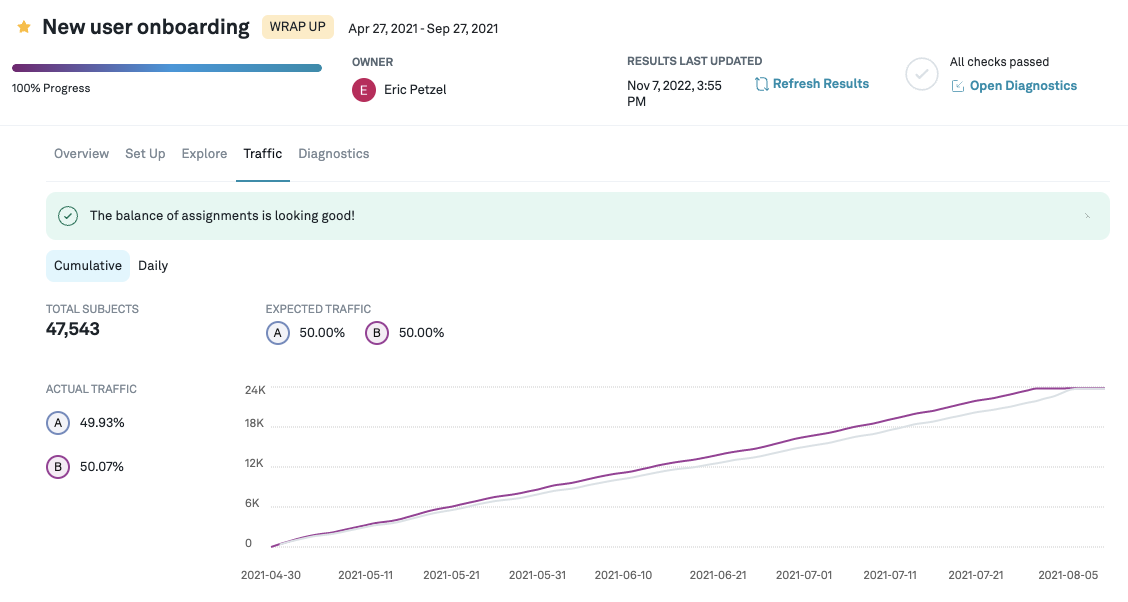
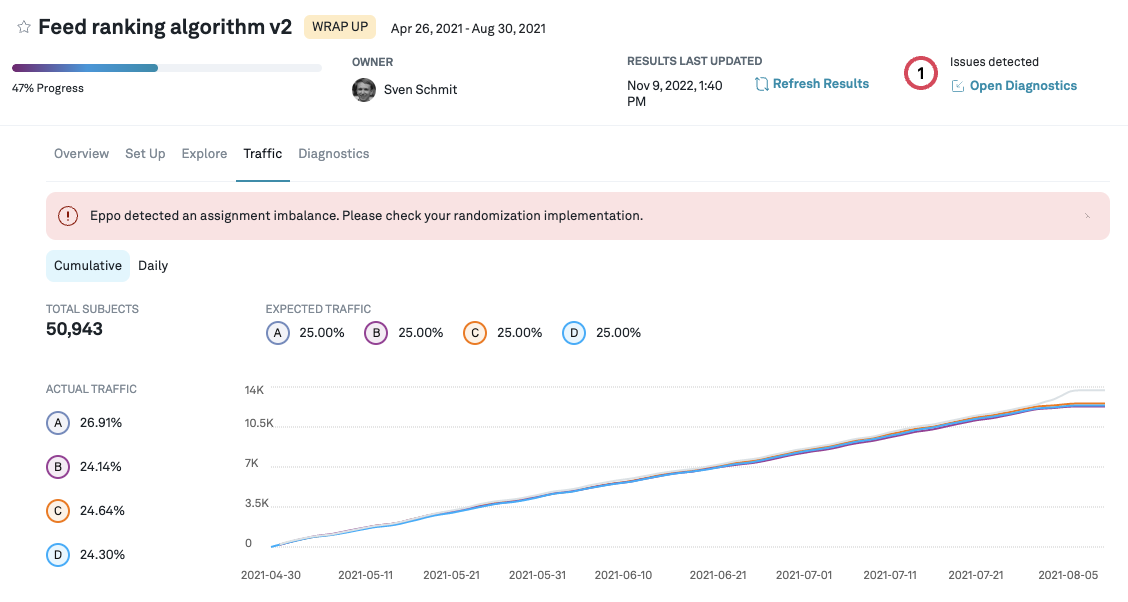
The Traffic tab shows you a comparison of the traffic seen between the variants being considered for the experiment. You can also toggle between seeing the cumulative, or daily traffic.

The traffic tab runs a test to see whether the randomization works as expected and the number of subjects assigned to each variation is as expected. When assignments are not balanced you will see a warning next to the tab and above the graph. This indicates that there is likely an issue with the randomization of subjects (e.g. a bug in the randomization code), which can invalidate the results of an experiment.

We run this traffic imbalance test by running a Pearson’s chi-squared test with on active variations, using the assignment weights for each variant (default is equal split across variations), which we convert to probabilities. This is also known as the sample ratio mismatch test (SRM).
We also perform dimensional SRM checks (see Dimensional imbalance diagnostic in the Experiment Diagnostics). For example, in a user randomized experiment, the user's platform (e.g., "desktop" or "mobile") may be recorded as an Assignment property. In this case, we would check for SRM for each value of the property. For this case, we use a Bonferroni correction to account for multiple comparisons.
The choice of may appear low, but is appropriate for a sample ratio mismatch test. It limits false positives while retaining statistical power near 100%.
- The SRM diagnostic is performed every time experiment results are updated, yet the test is not a sequentially valid. Because of the continuous ``peeking'', the effective is higher.
- False positives are expensive: they can lead to wasteful investigations (it's near impossible to definitely conclude that there is no source of SRM), or cast doubt on experiment results more generally. The conservative makes it very unlikely that an alert will be fired where there is no SRM.
- Sample ratio mismatch tests have very high power in typical settings (large samples, experiment allocation far from 0% and 100%). Whenever a ratio mismatch is present, it will be detected with probability near 100%.
Alerts
When we detect a mismatch between expected traffic allocation and observed allocations in the data, Eppo surfaces a traffic alert both on the Traffic page, as well as the diagnostics page. Optionally, we also send a Slack notification.

While it is not always easy to understand down what caused the alert, it is important to track it down and understand its source. Traffic imbalance often indicates that the results of an experiment cannot be trusted.
Issues with the traffic allocations can come from many sources; here are some common ones we have seen:
- There is an issue with the logging assignments (note this could be introduced through latency)
- Traffic allocations are updated in the middle of an experiments; in general, try to avoid changing the traffic allocations during an experiment
- Assignments for one variant (e.g. the control cell) started before assignments to other variants