Usage
An experiment’s statistical power, or ability to detect treatment effects in a particular metric, is determined by the number of subjects in the experiment, as well as that metric’s mean and variance. Eppo provides a dedicated interface for computing Minimum Detectable Effects for various experiment runtimes using historical data in your data warehouse. To use Eppo’s Sample Size Calculator, you or someone at your company will first need to set up one or more Entry Points. The rest of this article assumes that an Entry Point has been configured, and that you are ready to perform a sample size calculation.
Setting up a sample size calculation
Start by opening the Sample Size Calculator using the button in the top-right corner of the Experiments page.

Here you can see a record of all past calculations, which are automatically saved and can be referenced and linked to as needed. Click Create New Calculation to continue.
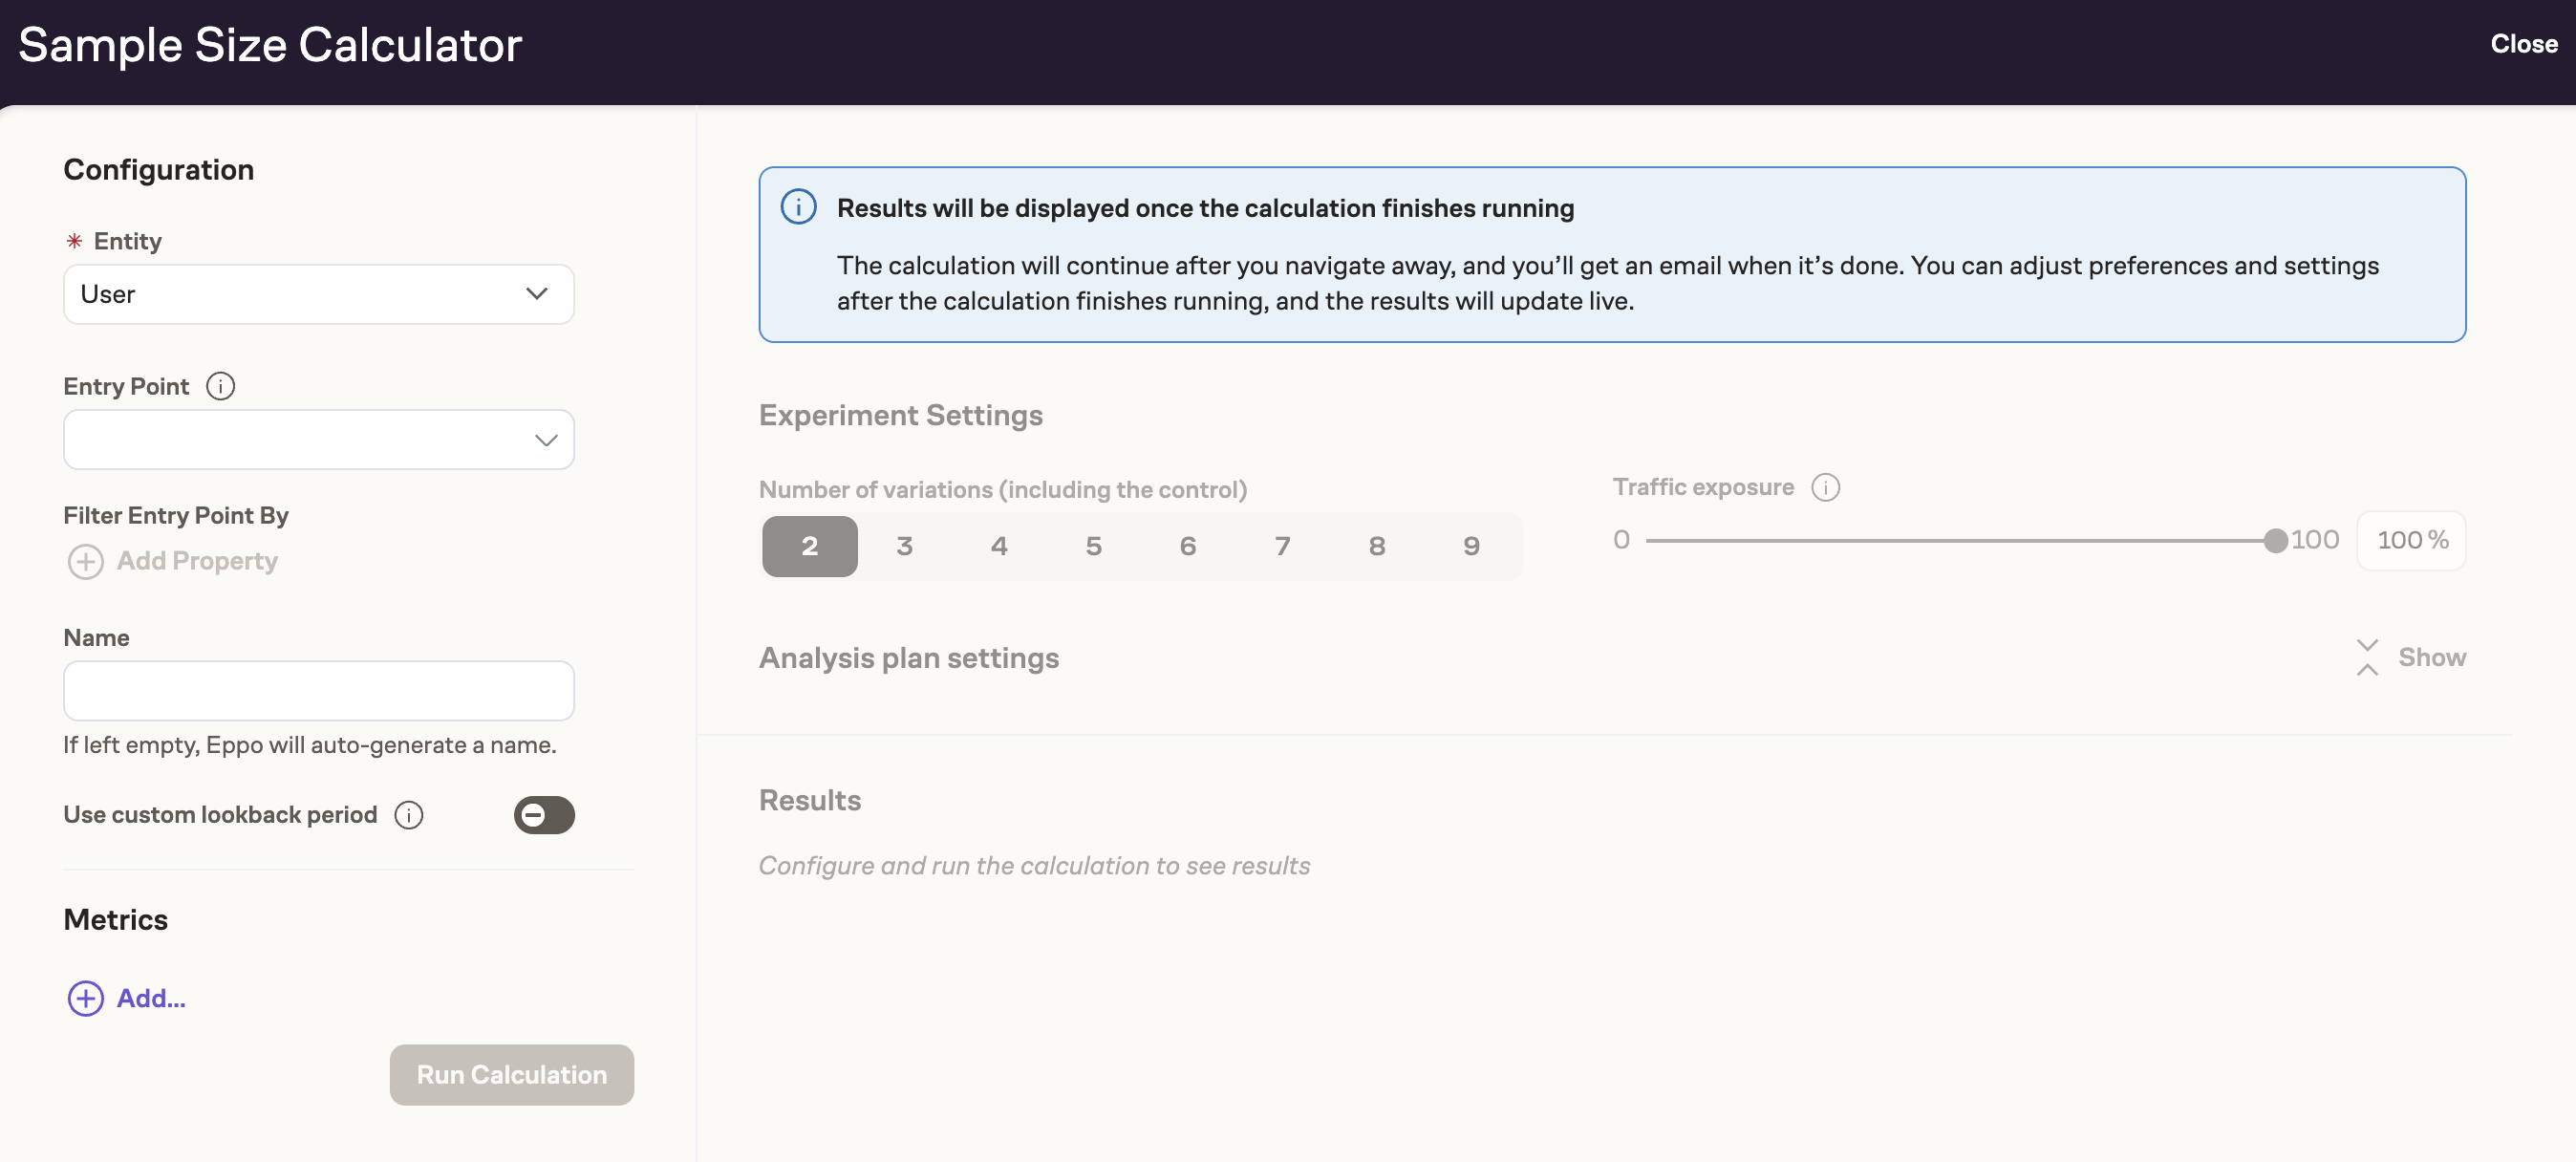
Use the controls on the left to configure the sample size calculation. Select the experiment Entity, the Entry Point, an optional Entry Point filter, and metrics you want to compute Minimum Detectable Effects for. You can customize the saved calculation name or use the auto-generated name.
An Entry Point filter allows you to restrict the sample size calculation to a specific subset of entities based on their entity properties. For example, you might want to calculate the required sample size only for users in a particular country or with a certain account type.
When configuring an Entry Point filter, you can select from entity properties (such as user attributes) rather than assignment properties. This is because:
- Assignment-based entity properties require assignment context that isn't available during sample size calculation.
- Sample size calculation happens before assignment data is available, making assignment-based properties incompatible.
In other words, since the sample size calculator is used to plan experiments before any assignments have occurred, only properties that are intrinsic to the entity (and available in your data warehouse) can be used for filtering at this stage.
You can optionally set a custom start date for the lookback period. By default, the sample size calculator uses the most recent 10 weeks of data as the lookback period, with all timespans (1 week, 2 weeks, etc.) ending at the current date. With a custom start date lookback period, the historical data for each timespan will instead start at the custom start date you select. This option can be useful when the most recent data has quality issues, or when seasonality makes the most recent data less representative of the traffic patterns that will hold during the experiment.
Funnel metrics are not supported in the sample size calculator.
You do not need to include all metrics you intend to add later to your experiment analysis.
Instead, only include metrics for which you need to reach the target precision to make a ship/no-ship decision. These will typically be:
- your primary metric, to verify that the effect size you anticipate from the experiment is greater than or equal to the Minimum Detectable Effect;
- any guardrail metrics for which you need precise estimates to establish that the guardrail is met (possibly using a non-inferiority test).
After you have selected the metrics you're interested in, click Run Calculation. The setup is now saved and the calculation will begin in the background. You will receive an email when the calculation is completed, and the page will automatically refresh when completed. You are free to leave this page and come back later, without losing any work.
Adjusting settings and interpreting the results
Before looking at the results, you may optionally adjust the settings.
Number of Variations includes the Control, and so has a minimum value of 2. Traffic Exposure is the percent of traffic (that is, of observed entries) that you plan to enroll in the experiment. Combined with the simulated experiment data, these two numbers will determine the number of subjects available for the planned experiment over various time periods. The default settings of 2 variations and 100% will result in the smallest Minimum Detectable Effects.
The Statistical Analysis Plan settings are initialized to your company defaults. If you intend to run the experiment analysis using other settings, you should select the same settings here. If you are unsure what to do, stick with the defaults.
Changing any of these settings does not require a new calculation; the results will be updated immediately. Feel free to try many different settings to understand the impact they have on sample size and Minimum Detectable Effects. When you are satisfied with the settings, you can save them by clicking Save Changes on the top-right of the page.
The table below the settings shows the sample size and Minimum Detectable Effects that you can expect to observe after various experiment runtimes. The numbers that you see in the table take into account the metric’s most recently observed mean and variance, as well as the number of unique entity IDs that were observed in the Entry Point data for each time period.

In statistical terms, Minimum Detectable Effect (MDE) is defined as the smallest lift that can be detected a certain percent of the time, while ensuring that the experiment's confidence intervals contain the true value a specified percent of the time. These two numbers (called Power and Confidence Level respectively) can be configured under Analysis plan settings. Lower power and confidence levels will give smaller Minimum Detectable Effects for all metrics, with correspondingly weaker statistical guarantees.
Once you have determined the appropriate settings, you can use the full table to understand the tradeoff between runtime and MDE. Longer experiments will enroll more subjects and hence have smaller MDEs.
To pick a runtime, you need to know the effect size you would like to detect. This is not a value the tool can provide. Instead, use your knowledge of the change you're planning to test; effect sizes achieved by similar experiments, if any; and what effect would be large enough to be worth shipping. Once you have picked a target MDE, look for the column with the shortest duration whose MDE is smaller than your target. That column gives you the minimum runtime needed to reach your target MDE.
Often it is desirable to look at more than one metric at the same time. To determine the minimum runtime that satisfies requirements on multiple metrics, look for the column where all of the MDEs are smaller than the required MDEs.
The required MDE is not necessarily the same for all metrics: for example, you may desire a smaller MDE for a critical guardrail metric, to have a tighter control on degradations. Adding more metrics will either increase the minimum runtime or leave it unchanged, but never decrease it.
Below the main table interface, you will find a natural-language presentation of the same data. This interface may be useful for explaining the MDE calculation to others. The data used for this presentation is the same as that used in the table above.
Adding or removing metrics
Unlike settings, metrics cannot be changed after you run the sample size calculation. Adding or removing metrics requires creating and launching a new calculation. You can do so by clicking the Duplicate button that appears for completed calculations. This will create a new calculation with all the parameters copied over. You can then add or remove metrics as needed, and finally click Run Calculation.
If a previous calculation for the same entry point already contains all the metrics you are interested in, you can save time and compute by re-using that saved calculation (accessible by URL). Note that this may include metrics that are not relevant to you; and all analysis settings are shared.
Statistical details
Eppo supports fixed-sample confidence intervals as well as sequential confidence intervals (fully sequential and hybrid sequential). The type of confidence interval will determine the formula that is used for each metric’s MDE.
For fixed-sample experiments, the relative Minimum Detectable Effect is given by
Where:
- and correspond to z-scores of the selected significance level and power
- and represent the metric’s estimated mean and variance over the chosen time period
- represents the number of subjects that will be assigned to each variation, using the estimated traffic for the time period, the number of variations, and the traffic allocation percentage.
The sequential version of the Minimum Detectable Effect is similar, but scaled by the width of a sequential confidential interval relative to a fixed-sample confidence interval.
If metrics are winsorized the sample size computation takes that into account.
The sample size calculator also checks the validity of the normal approximation used for the MDE calculation.