Funnel metrics
Funnel metrics allow you to track and analyze multi-step processes or user flows. By defining the sequence of events in a funnel, you can identify bottlenecks, drop-off points, and conversion rates at each step. This facilitates a granular analysis of user behavior and helps understand experiment effects throughout the user journey.
Eppo considers each step of the funnel as a binary outcome: either the user has made it to this step (at least once), or they have not. If a user completes the funnel twice, that is still counted as a single conversion.
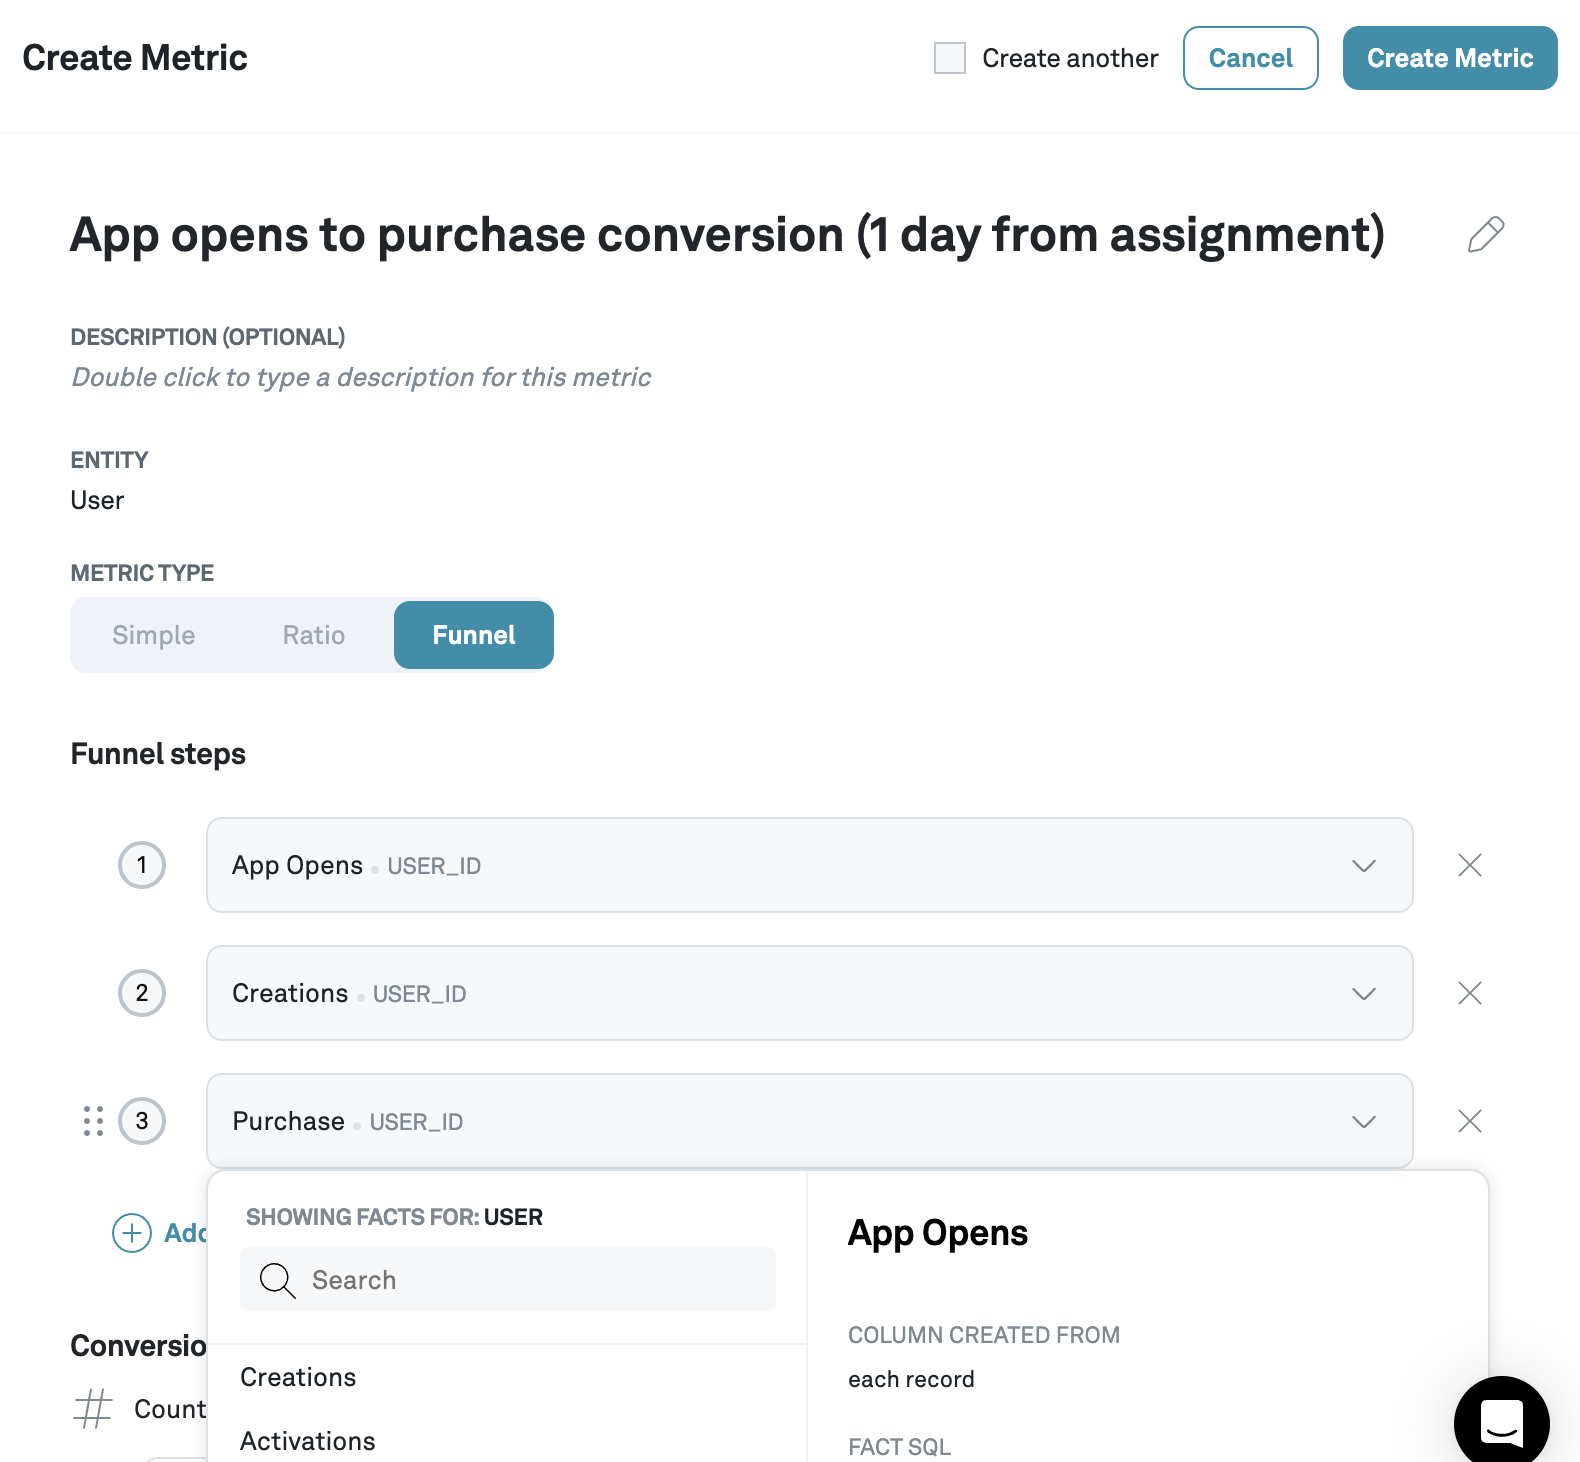
Creating a funnel
Creating a funnel requires you to specify a sequence of events that need to happen consecutively. A natural example of a funnel is the checkout flow for an ecommerce platform:
- User adds item to cart
- User clicks checkout button
- User fills out address
- User fills out credit card details page
- User confirms order
Each of these actions are connected to separate events, and we want to understand the user drop-off in each of the steps.
Make sure that, if a user hasn’t reached a step, the event in the corresponding table is either missing, or NULL and not marked as 0.
Eppo requires the funnel steps to happen in order, but does not care whether unspecified events happen in between the funnel steps.
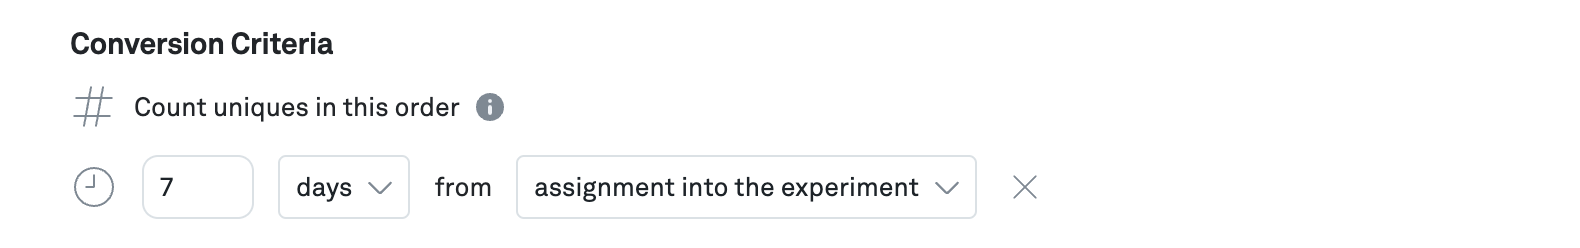
Time frames
You can additionally specify a time frame in which a user needs to complete the funnel in order to count as a funnel conversion.
There are three options:
- No time frame: as long as the user completes the steps in order, it counts as a conversion.
- Time window from time of assignment: the user has to complete the funnel within the set duration, where the time of assignment starts the clock.
- Time window from time of first event: the user has to complete the funnel within the set duration, but the clock starts at the time of the first step in the funnel for that user.
Analysis of funnel metrics
To analyze the effects of an experiment on a funnel, add it as a metric to an experiment as usual.
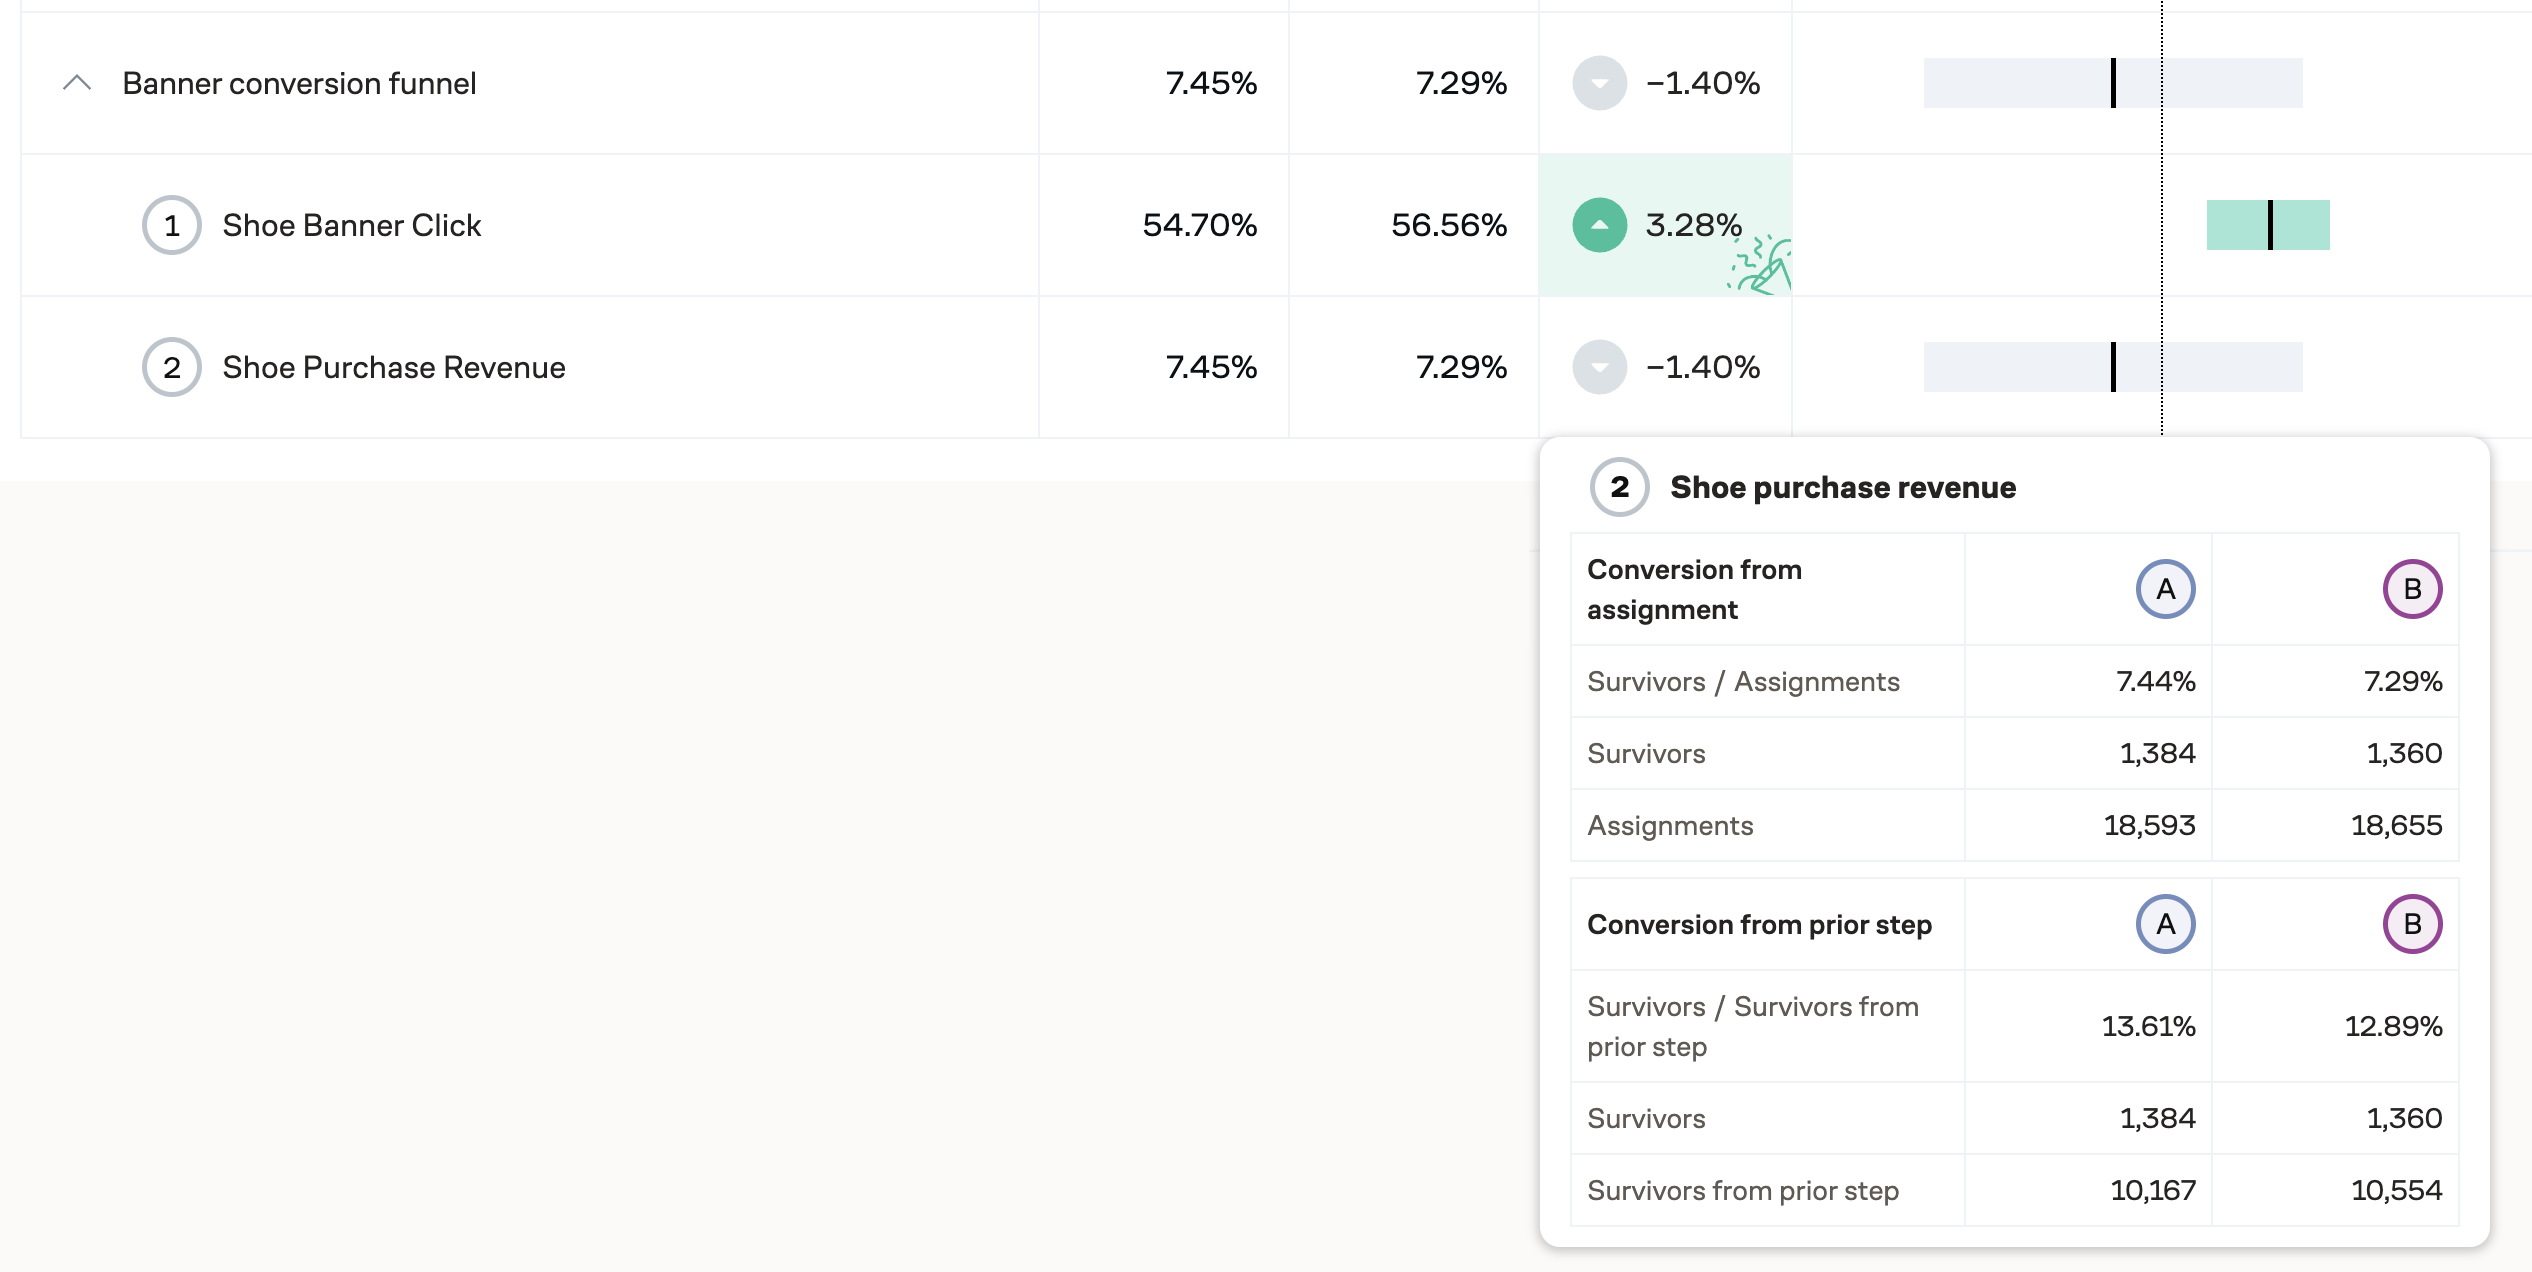
The results show the conversion rate from assignment to each particular step; the overall results thus are the same as the results for the last step. The popover shows additional details:
- survivors are the total number of users that made it all the way to this step in the funnel
- for steps after the first, the conversion rate from prior step: fraction of users who made it to the previous step in the funnel did not make it to this step
For steps beyond the first, comparing conversion rate from prior step across variants is fraught. The difference does not show the direct effect of the treatment on that step in the funnel alone, as might be expected. Instead, it also includes the indirect effects of changing the composition of users who reach the prior step. These indirect effects are often larger than the direct effect.
Because this is a common source of confusion, we do not display the lift in conversion rate from prior step nor its confidence interval. The only safe way to interpret treatment effects on funnel metrics is using the lift in conversion rate from assignment. This guarantees a valid comparison: at assignment, A and B groups are balanced because of randomization; after the first step, they are different and the comparison is apples-to-oranges.
The stylized example below illustrates how changes in conversion from prior step can be misleading. The setting is a checkout flow on an ecommerce platform. Users have a (hidden) characteristic: they are either high-intent or low intent.
| Stage | Control | Variant |
|---|---|---|
| Assignment | 1000 | 1000 |
| - High-intent | 300 | 300 |
| - Low-intent | 700 | 700 |
| Address form | 290 | 445 |
| - High-intent | 150 (50% of assignments) | 165 (55% of assignments) |
| - Low-intent | 140 (20% of assignments) | 280 (40% of assignments) |
| Checkout | 64 (22% of prior step) | ⚠️ 89 (20% of prior step) ⚠️ |
| - High-intent | 50 (33% of prior step) | 58 (35% of prior step) |
| - Low-intent | 14 (10% of prior step) | 31 (11% of prior step) |
The variant is effective for both high-intent and low-intent users. At every stage, and for both user types, it increases the conversion rate to the next step. This can be checked by looking at the rows for a single user type: in all of them, the variant has a higher % from prior step compared to the control.
The variant also changes the composition of users who complete the address form, from majority high-intent to majority low-intent. Because of this compositional change, it lowers the overall conversion rate from address form to checkout. This can be misinterpreted as the variant hurting the conversion rate at this step. It is not; in fact it improved it for all users. The proper way to analyze this result to look at conversion rate from assignment, which improved from 6.4% to 8.9%.
Exploring funnel metrics
Dive deeper into your funnel metric's performance by clicking the "explore" button or going to the Explore tab to create a new chart.
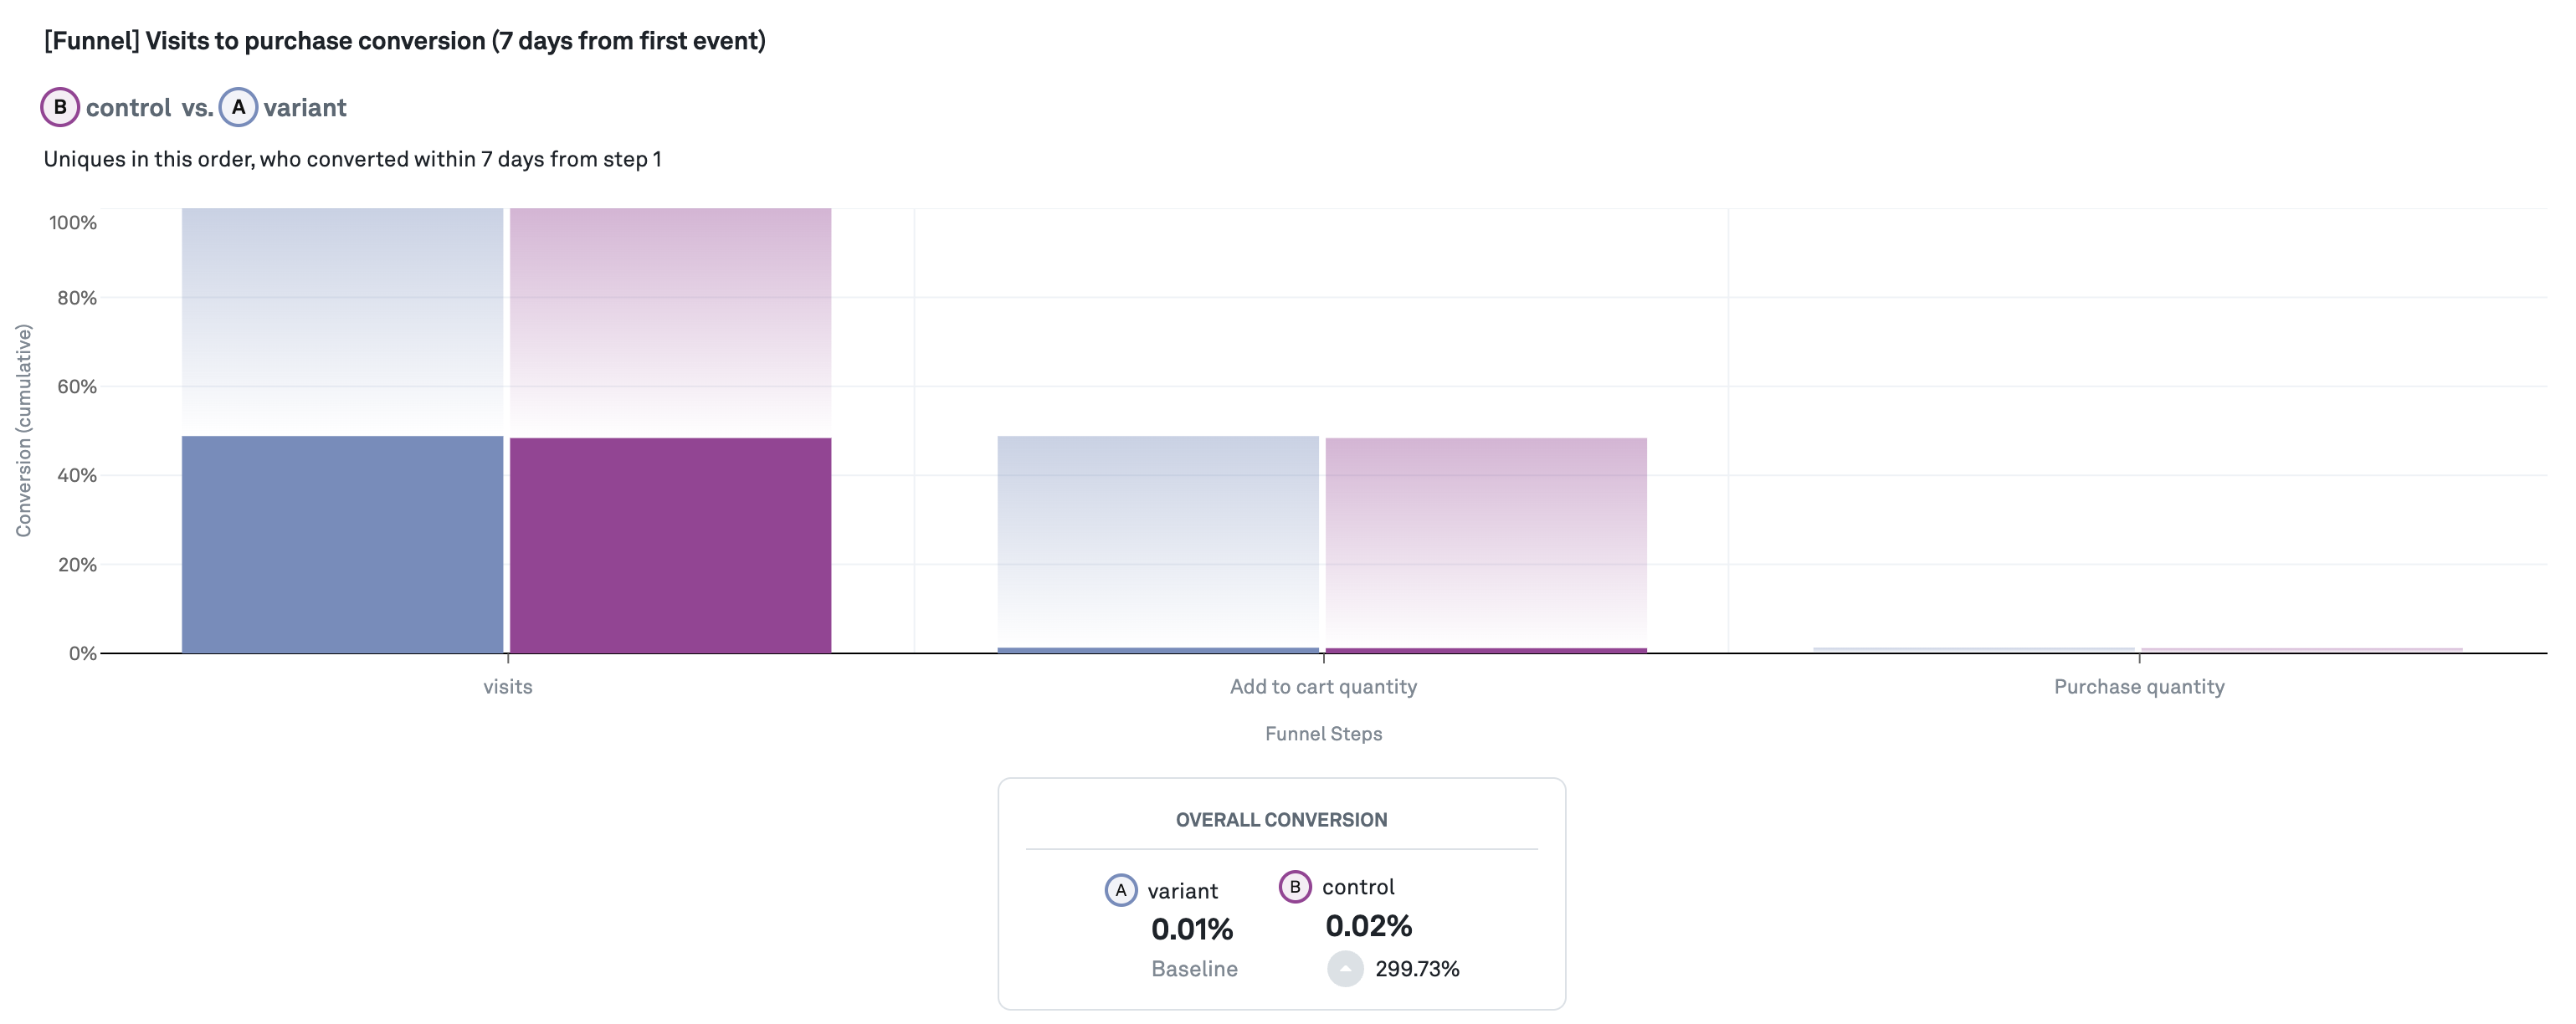
Funnel Steps
The funnel steps visualization shows how each step of the funnel converted (cumulatively). The solid bars represent the conversion from assignment into the experiment and the gradient represents the drop-off. You can view further details and the survivor count in the tables below.
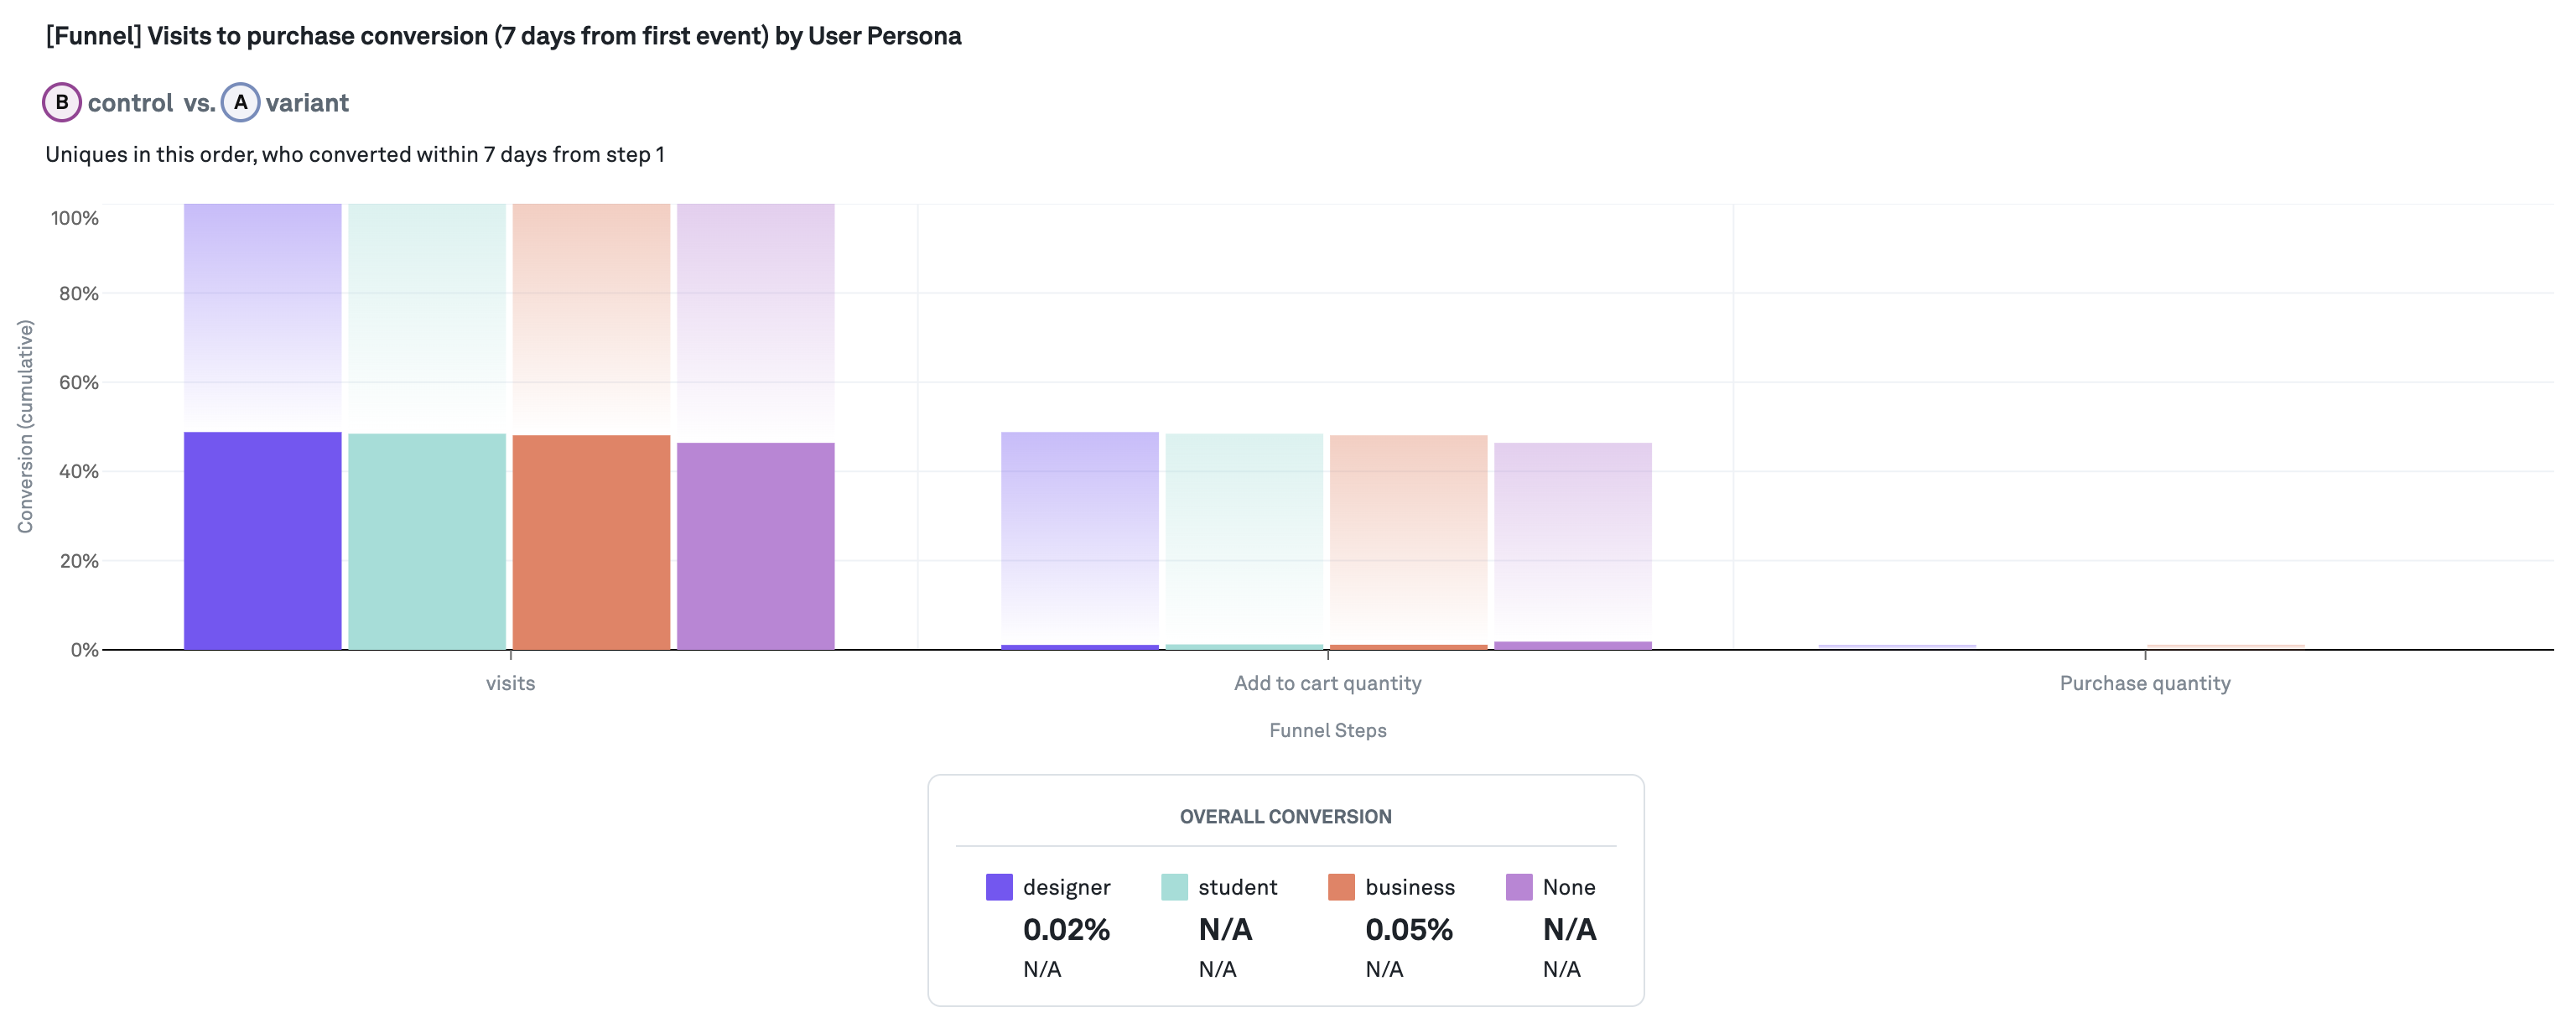
Apply split bys to your funnel to see how the funnel performed for different properties.
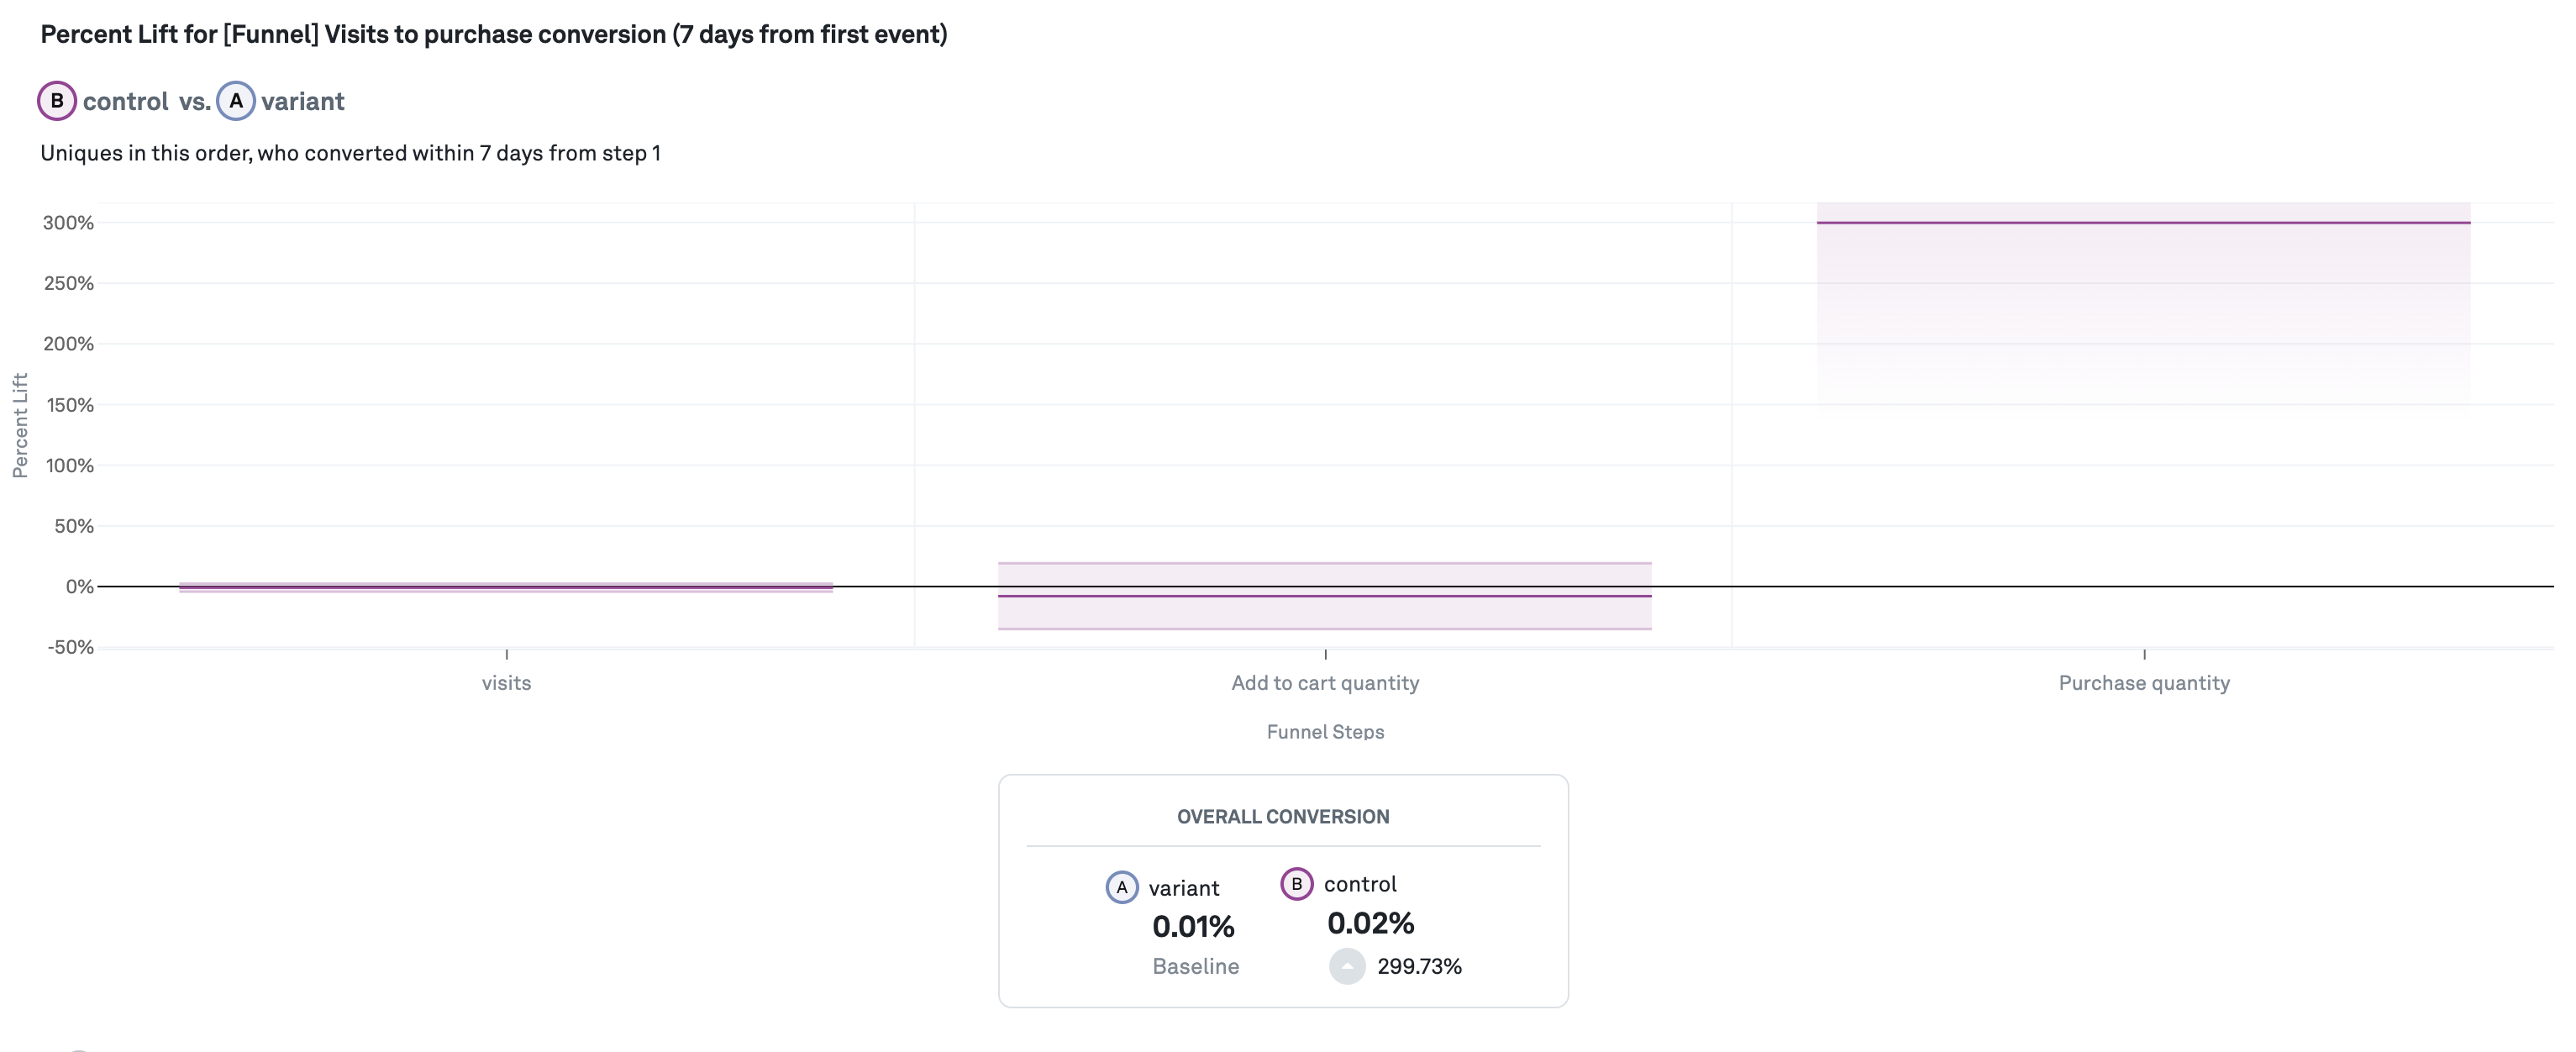
Funnel Lift
The funnel lift visualization shows for each step the relative percent lift in comparison to the control variant.