Ratio metrics
Overview
Ratio metrics allow you to calculate the ratio of two fact aggregations. Unlike Simple metrics, which normalize a fact aggregation by the number of unique entities (e.g., users) in the experiment, ratio metrics normalize a fact aggregation by another user-defined fact aggregation. To make this concrete, let's consider a few examples.
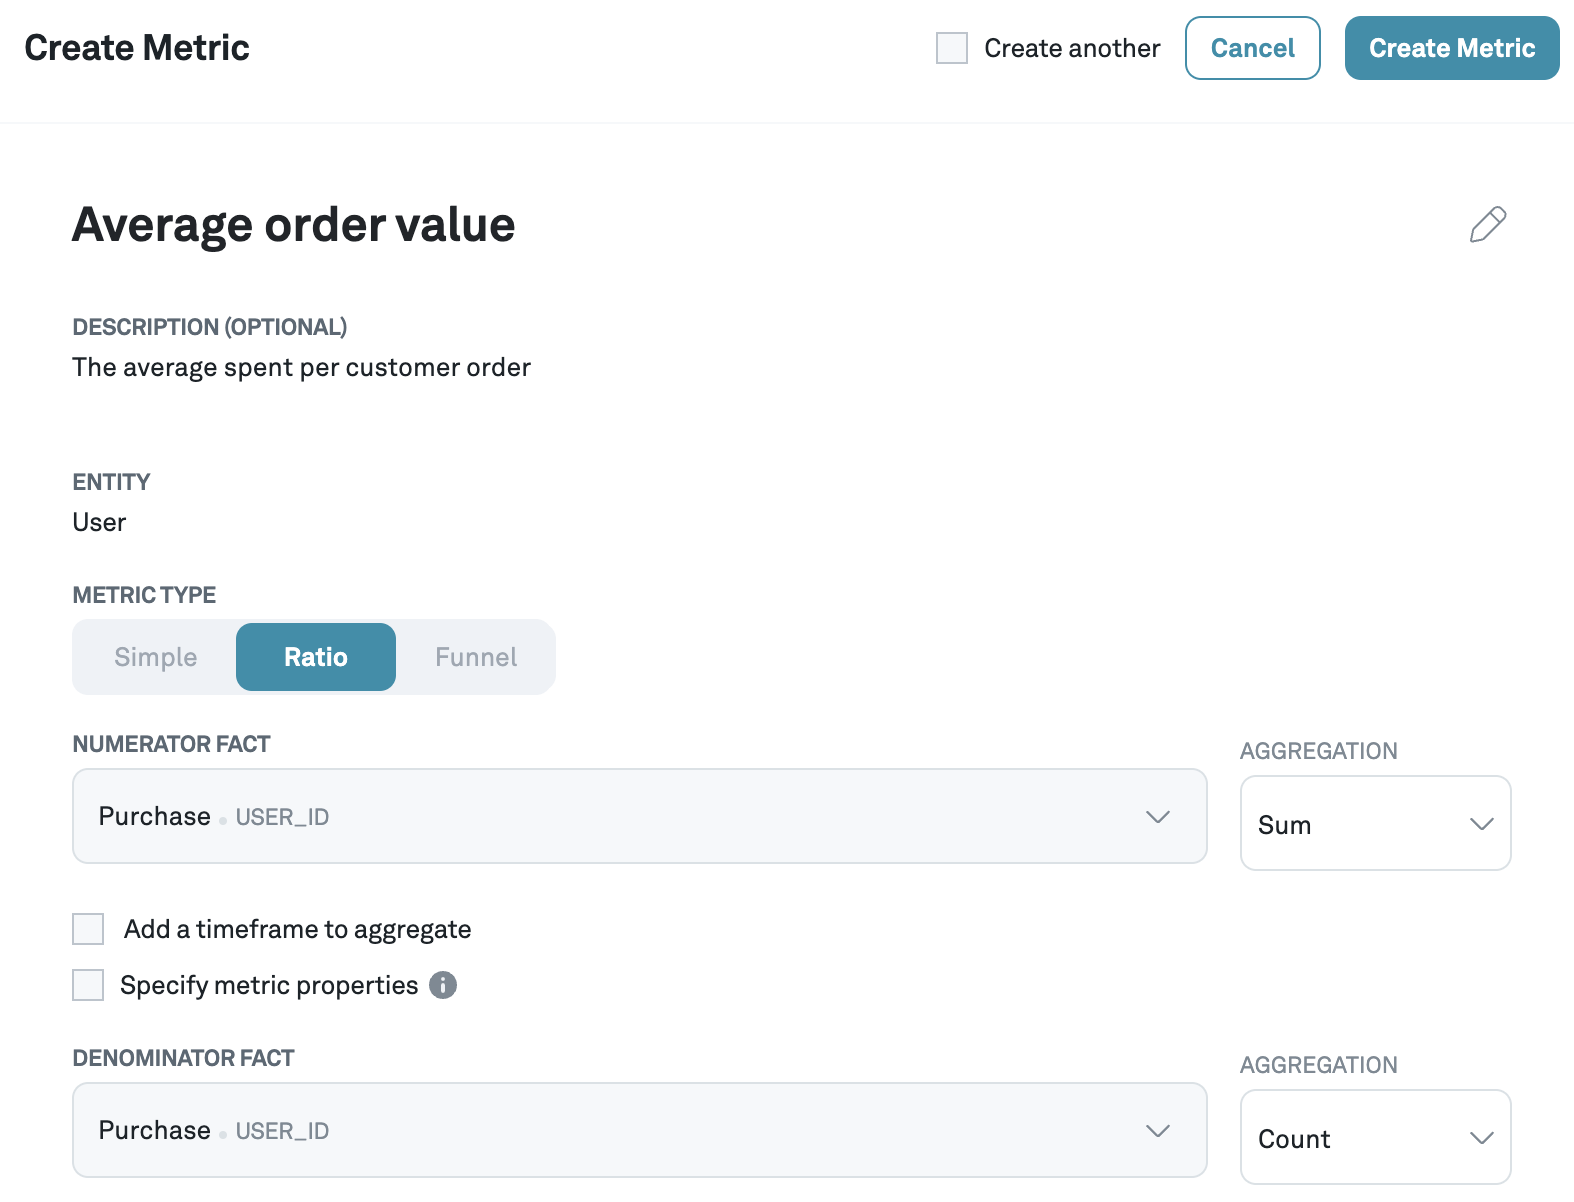
Example 1: Average Order Value (AOV)
Average order value is defined as the total amount of revenue divided by the total number of orders:
This metric is often calculated in experiments that are randomized at the user level. However, it is clear from this metric's definition that we need to normalize by the number of orders rather than the number of users (which simple metrics would do automatically). To capture this custom aggregation logic in the denominator, we define it as a ratio metric. The numerator aggregation is the sum of revenue, and the denominator aggregation is the count of orders.
Example 2: Average revenue per paying user (ARPPU)
Average revenue per paying user is defined as the total amount of revenue divided by the total number of payers in the experiment.
Although this metric is a ratio metric, it is closely related to a simple metric, which makes this example especially useful for illustrating the difference between the two metric types. If we wanted to define the metric average revenue per assigned user, that would be specified as a simple metric because it is "per assigned user" and, therefore, is normalized by the entity count (a defining characteristic of simple metrics). However, ARPPU is "per paying user." The fact that we are normalizing by only a count of a subset of users rather than a count of all assigned users indicates that ARPPU must be specified as a ratio metric. In this case, the numerator aggregation is a sum of revenue, and the denominator aggregation is a count of unique payers.
Ratio metrics are computed by first computing averaged values for the numerator and the denominator, and then dividing them to compute the ratio, rather than computing the ratio on a user level and then taking the average.
We use the Delta method to compute valid statistical results for ratio metrics.
Creating a ratio metric
In general, the steps to define a ratio metric are as follows:
- Define the metric you wish to calculate and identify its analysis unit (e.g., an order in average order value or X in a metric that has "per X" in its name)
- Identify the fact and aggregation for the numerator. In most cases, this will be a sum or a count (e.g., a sum of revenue).
- Identify the fact and aggregation for the denominator. In most cases, this will be a count of the analysis entity from step 1 (e.g., a count of purchases/orders). Verify that the aggregation is not a unique count of assigned entities because that means your metric is a simple metric rather than a ratio metric.
Once you have identified your desired ratio metric and its constituent fact aggregations, you can define it in Eppo using the same process as creating a simple metric. Of course, the difference is that for a ratio metric, you have to select both a fact and an aggregation for the numerator and denominator.