Simple metrics
Metrics play a pivotal role in experiment analysis within Eppo, offering quantitative measures to assess the performance of various variations in an experiment. In this page, we'll delve into simple metrics, which aggregate data over specific entities. Simple metrics are highly configurable and support a wide variety of use cases.
Anatomy of a simple metric
Simple metrics aggregate fact events defined in SQL to the experiment level. Specifically, this aggregation is done in two steps:
- First, the events are aggregated at the entity level (e.g., user) using a specified aggregation method
- Second, the entity-level values are averaged across entities and analyzed by Eppo's statistics engine
For example, to compute a revenue metric Eppo will first sum revenue by user. Then, Eppo will compute the average across all users by experiment variant. A simplified version of the SQL Eppo runs looks like this:
WITH user_summaries AS (
    SELECT
        assignments.user_id,
        assignments.variant,
        SUM(revenue.revenue_amount) AS user_revenue
   FROM assignments -- Eppo will manage assignment deduplication
   LEFT JOIN revenue
     ON revenue.user = assignments.user
    AND revenue.timestamp >= assignments.timestamp
  GROUP BY assignments.user_id, assignments.variant
  WHERE revenue.timestamp BETWEEN <experiment_start> AND <experiment_end>
)

SELECT
    variant,
    AVG(COALESCE(user_revenue, 0)) as metric_estimate
FROM user_summaries
GROUP BY variant
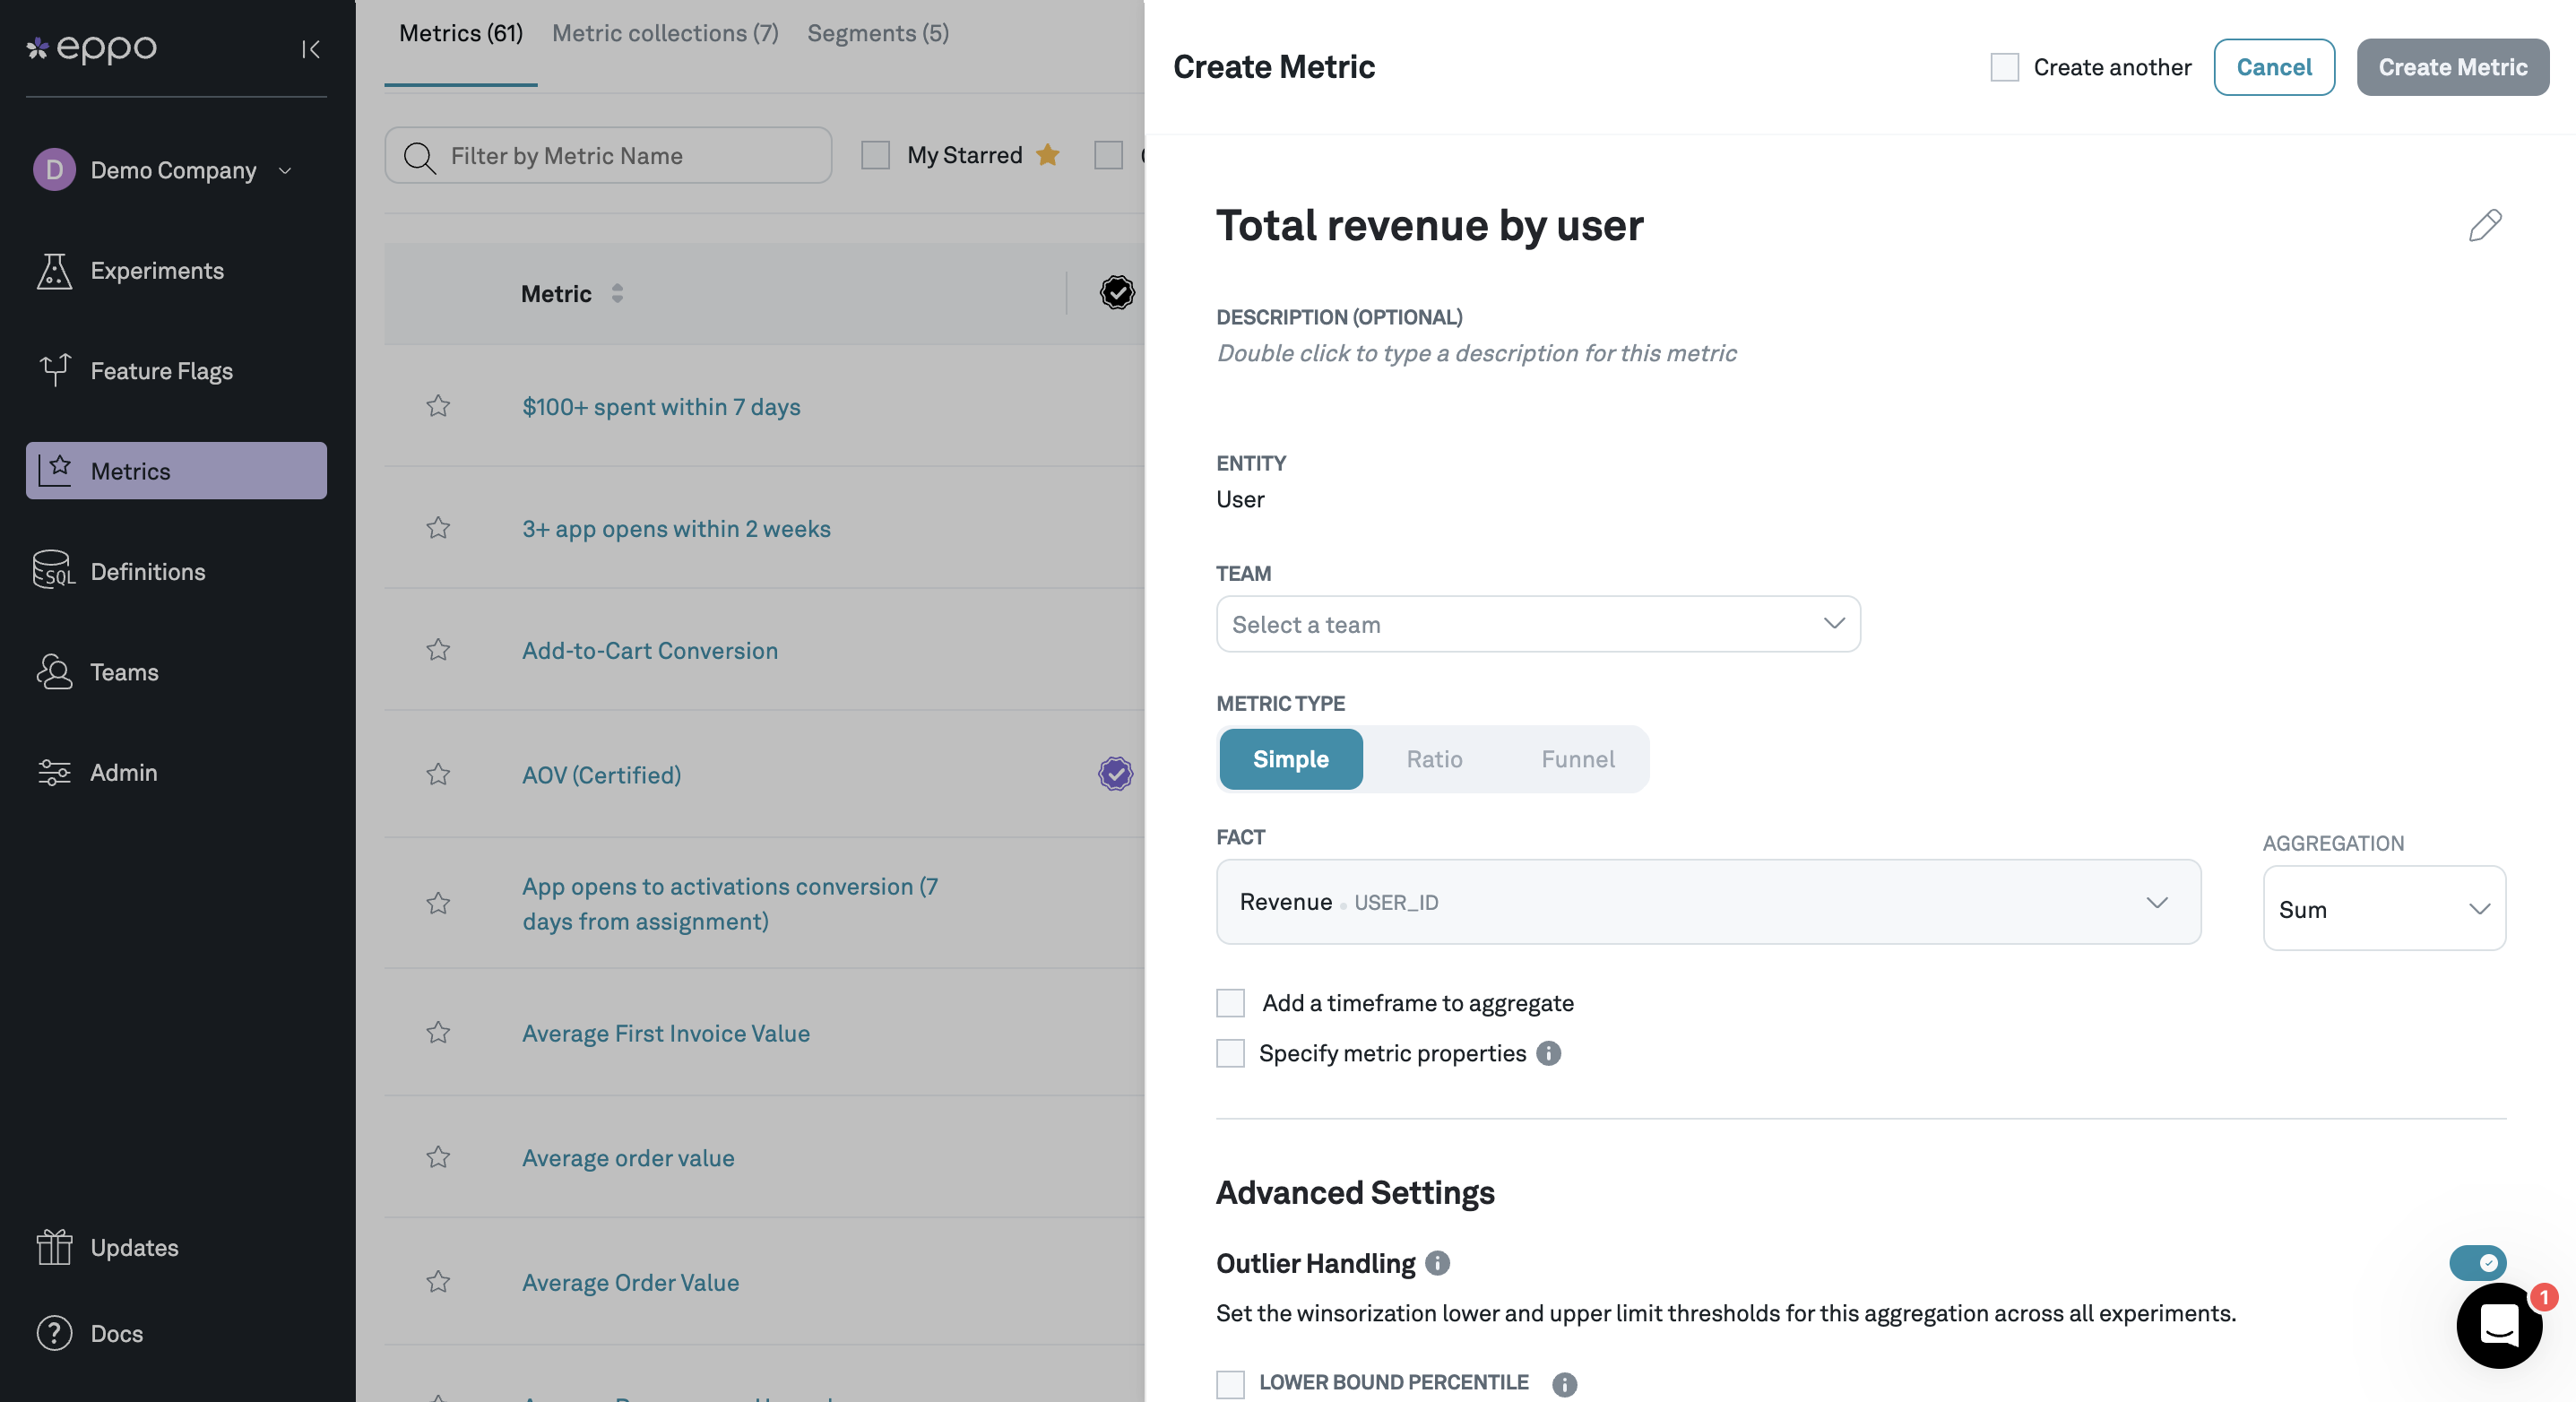
Creating a metric
Creating a simple metric in Eppo consists of the following steps:
- Navigate to the Metrics page, click + Create and select Metric
- Select the fact you wish to analyze
- Tell Eppo how to aggregate the fact to the entity level
- (Optional) Add filters based on time since assignment and/or fact property values
- (Optional) Configure outlier handling by setting winsorization thresholds
- (Optional) Set a default precision target and display format
Aggregation methods
This section describes each of the aggregation methods that Eppo supports, along with illustrative SQL code and a few example metrics. Note that for all aggregation types, metrics are normalized by the number of subjects (users) in the experiment. NULL-valued facts are not included in metric aggregations.
Eppo supports the following aggregations:
Sum
Sum computes the total fact values by entity (excluding NULLs). Sums can be interpreted as averages across entities:
In the Eppo pipeline, sums are calculated like this:
select
  <entity_id>,
  sum(<fact_col>)
from ...
group by 1
Examples of sum metrics include average revenue per user, minutes streamed per user, etc.
Unique Entities
Unique Entities computes the number of unique entities with a non-NULL event. If the fact value is NULL, it is discarded.
In SQL, unique entities metrics are calculated like this:
select
  distinct <entity_id>
from ...
where <fact_col> is not null
Examples of unique entity metrics include: the percent of users who watched a video, viewed an article, or entered checkout.
Count
Count computes the number of events per entity. If the fact value is NULL, it is discarded.
Or, in SQL:
select
  <entity_id>,
  count(<fact_col>)
from ...
group by 1
Examples: videos watched per user, articles viewed per visitor, orders per user.
Count Distinct
Count Distinct computes the number of unique non-NULL values in a fact. Unlike Unique Entities above, this option allows you to counting a number of unique values other than the entity identifier.
In SQL:
select
  <entity_id>,
  count(distinct <fact_col>)
from ...
group by 1
Examples: number of unique videos watched per user (if the same video is watched twice, it only counts once), number of unique articles viewed per visitor, number of unique items ordered (if an item is ordered multiple times, it only counts once).
By default, we use a naive array-based algorithm for count distinct metrics which is 100% accurate but can be resource-intensive and time-consuming. We also support the HyperLogLog algorithm, which is much more efficient but can incur a small loss of precision. Contact Eppo support if you would like to use HyperLogLog instead of Array.
For customers on Redshift we only support HyperLogLog. The necessary methods for array-based algorithms are not currently supported.
Count Distinct is a more expensive operation than Count, especially when there are many unique values in the fact column. You should only use Count Distinct when it is crucial for the definition of your metric to ignore repeated values. When repeated values are naturally rare, a Count metric will give similar results to a Count Distinct metric and will incur lower warehouse costs.
For example, consider a podcast app with a fact that logs podcast listen events, each with an episode id and a show id. We are interested in two types of outcomes:
- Unique shows listened per user, to measure diversity of content consumption.
Count Distincton the show id is needed to capture this correctly.Countwould not be an adeguate replacement, because it would also increase when users listen to more episodes from shows they already listen to. - Episodes listened per user, to measure overall content consumption. This can be captured correctly with a
Countmetric. Since repeated listens to the same episode are rare, usingCount Distincton episode id would give similar results but incur higher warehouse costs.
Last Value
Last Value computes the most recent value of a numeric fact. It can be interpreted as averages across entities:
In SQL:
select
  <entity_id>,
  last_value(<fact_col>) over (partition by <entity_id> order by <fact_timestamp>)
from ...
Examples:
- Recording changes to the current status of a user, such as if a user has mobile notifications enabled
- Using ML models to create surrogate or proxy metrics. Each user has a prediction, the prediction changes over time, and the metric should use the most recent prediction for each user.
- Data that is already aggregated at the subject level, such as purchases by user
Retention
Retention metrics measure the proportion of entities with at least one event after a fixed number of days (X) from experiment assignment. For example, a 7-day retention metric on website visits would measure the proportion of users who visit the website at least 7 days after being assigned to the experiment.
Only entities that were assigned at least days ago are included (those assigned within the last days cannot yet have retained and including them would make retention appear lower than expected).
In SQL:
select
  distinct <entity_id>,
from ...
where fact_timestamp >= assignment_timestamp + X days
and assignment_timestamp < current_date - X days
Additionally, a maximum number of days (Y) can be set on the retention period by enabling "add a timeframe to aggregate". When this is enabled, the aggregation will include events by subjects after the minimum number of days defined by the retention period (>=X) and before the max timeframe to aggregate (<Y).
Conversion
Conversion metrics measure the proportion of entities with at least one fact event within a fixed number of days (X) from experiment assignment. For example, a 7-day conversion metric would measure the proportion of users who sign up for a free trial within 7 days of being assigned to the experiment.
In SQL,
select
  distinct <entity_id>
from ...
where fact_timestamp <= assignment_timestamp + X days
Optionally, you can enable filtering out subjects until they are aged. This will only count events once a subject has been assigned to the experiment for the conversion period specified. Using the example above, a subject will only be included once they've been assigned to the experiment for 7 days.
Threshold
Threshold metrics measure the proportion of entities who meet a user-specified SUM or COUNT of a fact within an optional time-period. For example, you might want to understand what percent of users spend more than $100 within 7 days of assignment into an experiment.
In SQL:
select
  distinct <entity_id>
from ...
where fact_timestamp <= assignment_timestamp + X days
group by <entity_id>
having sum(<fact_col>) > {threshold}
Time windows
Eppo allows you to further refine metrics by adding a time window. Based on specifying a time window to start after X days within Y days of assignment, the time window is calculated as X <= event datetime < Y. For example, we may be interested in a metric that only considers purchases starting two days after and within seven days of the user's assignment to an experiment, which is calculated as 2 days <= event assignment datetime < 7 days.
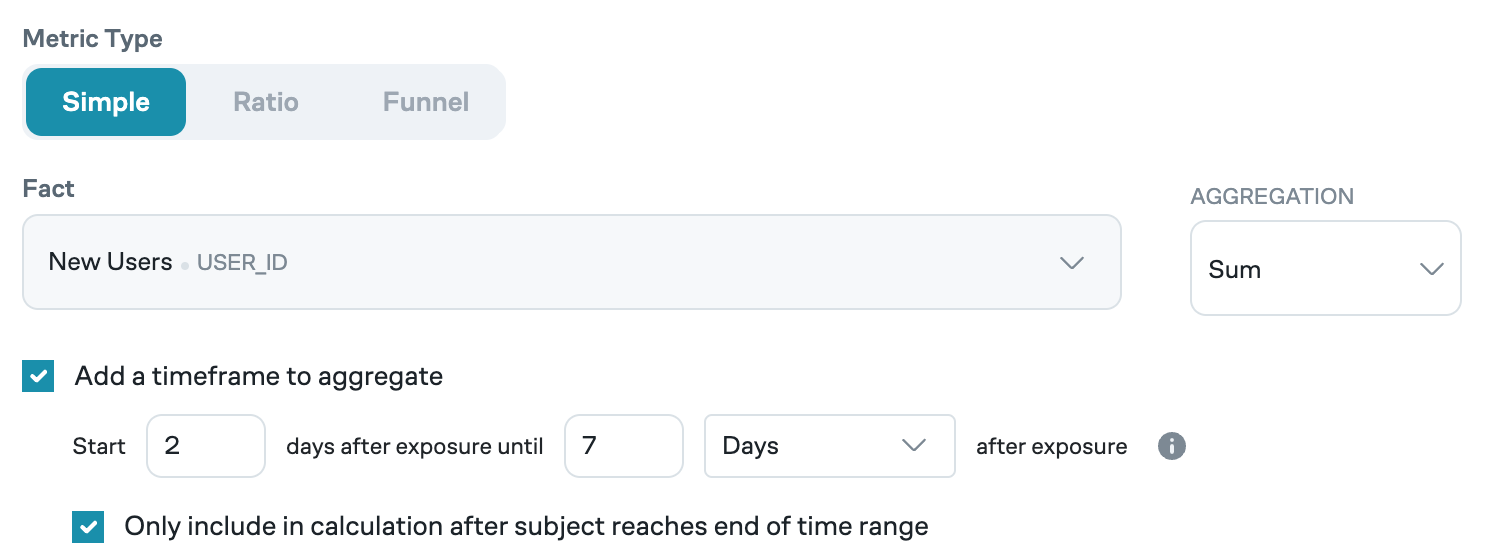
Eppo offers time units of minutes, hours, days (from initial assignment), calendar days, and weeks.
- Days from assignment starts at the time the subject is assigned. Every 24 hours since assignment counts as a new day. For example, if a subject is assigned at 9 AM on January 1, the next calendar say will start at 9 AM January 2.
- Calendar days counts a new day at midnight on the clock. For example, if a subject is assigned at 9 AM on January 1, the next calendar say will start at 12 AM January 2.
Counting aged subjects
You can define how metrics with a time window are calculated by enabling the option to "only include in calculation after subject reaches end of time range".
- When this option is disabled, all subjects assigned to the experiment will be counted. For example, a seven-day revenue metric will count all subjects who have been assigned into the experiment, including those who have been in the experiment for less than seven days.
- When this option is enabled, only subjects who have reached the maximum exposure time of the metric window will be counted. For example, a seven-day revenue metric will count only subjects who have been assigned into the experiment for seven or more days, excluding those who have been in the experiment for less than seven days.
Consider adding a time frame metric to experiments where you believe the intervention has a short term effect. For example, sending a promotional email may boost engagement for one week. If the experiment runs for 4 weeks, adding a time frame to the metric prevents that one week of boosted engagement from being diluted.
If you are using an Entry Point, the starting point of the time frame is the Entry Point timestamp.
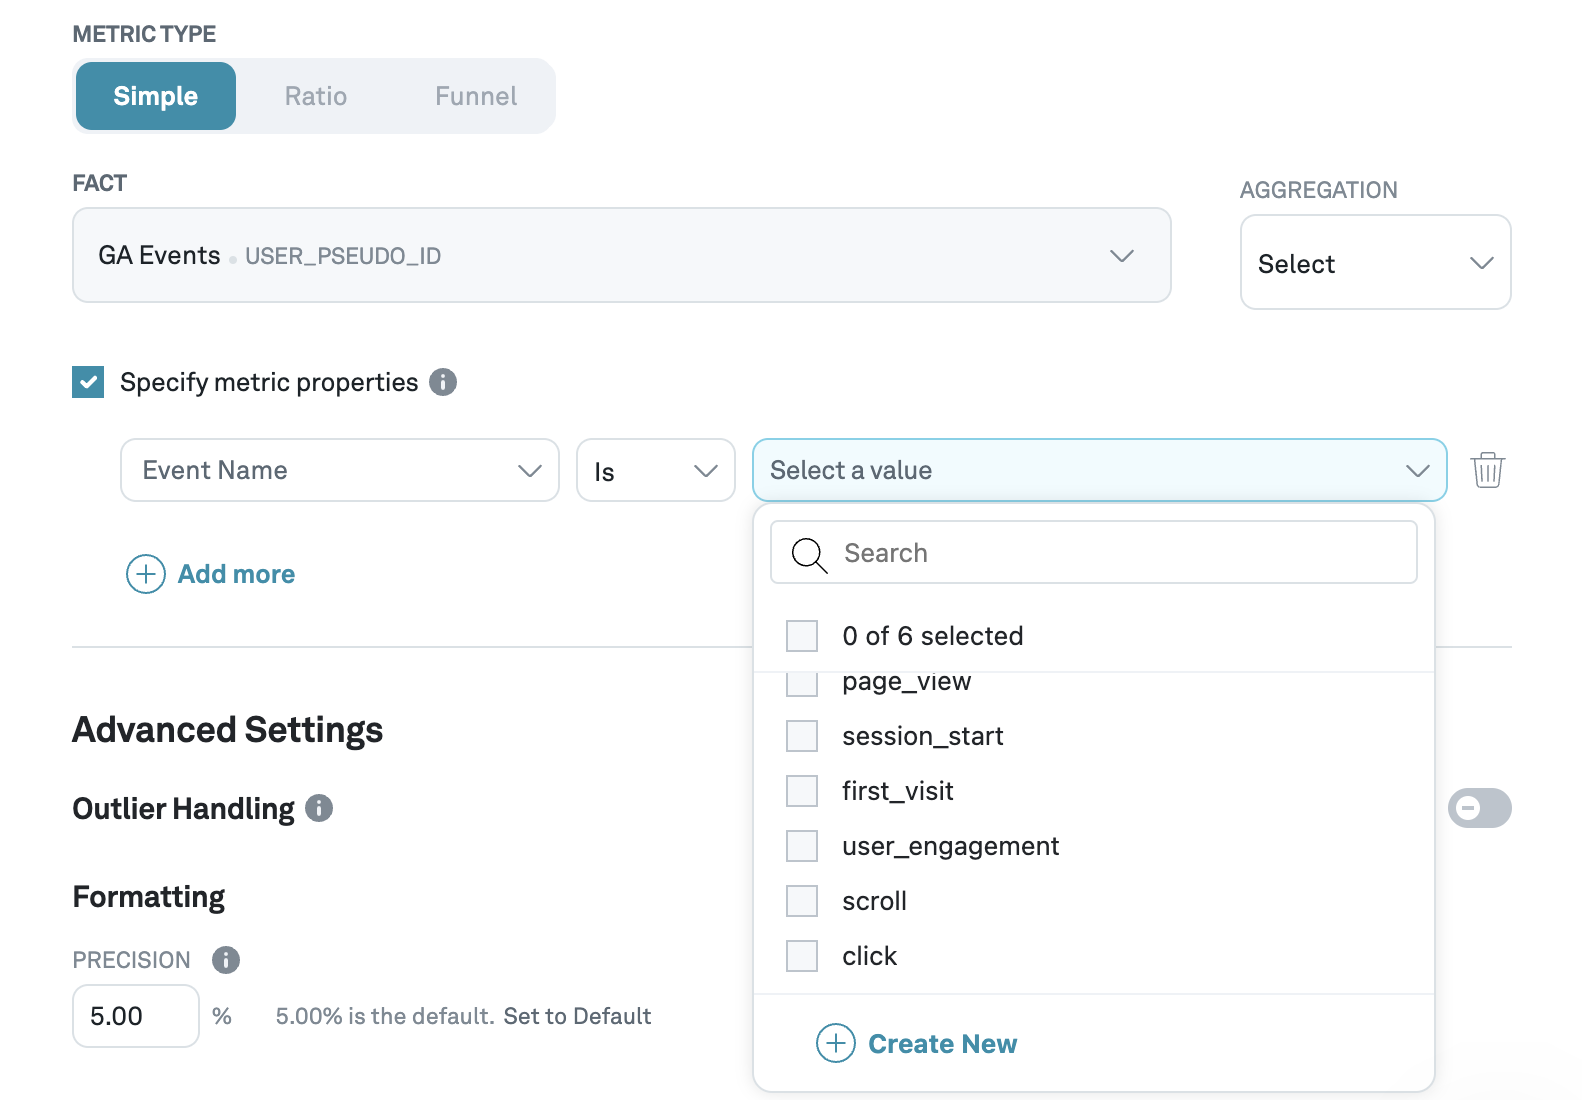
Metric properties
Metric properties allow you to filter events based on properties associated with the fact. For example, a streaming platform may run an experiment with watch time as the primary metric. We may be interested in understanding the impact not just on total watch time, but also on movie watch time and series watch time separately. In this case, you can add video type as a property on the Fact SQL and create separate metrics for movies and shows.
To apply a property filter, select Specify metric properties, select the property of interest, and the specific values of interest. Eppo will run a scheduled job to determine the different values a property may take, but if your specific value is not yet available, you can add it manually by clicking Create New.
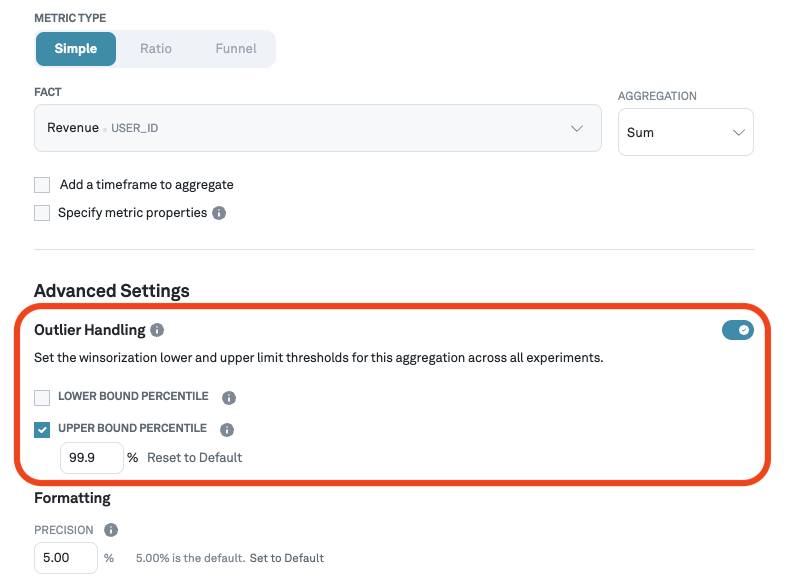
Outlier handling
Eppo handles outliers through a technique called winsorization. The percentiles used for lower and upper bounds can be configured per metric. For example, in the screenshot below, we are setting the upper bound for winsorization at the 99.9th percentile. This means that any user with a value above the 99.9th percentile will be replaced with the 99.9th percentile value.
Note that winsorization is only available for SUM, COUNT, and COUNT DISTINCT aggregations. This is because conversion and retention metrics are binary variables that are not prone to influence from outliers. As a result, winsorization is not needed for these metric types.
Set a default precision target
Precision refers to the uncertainty within which you want to measure. You can set a default at the metric level, which will be used to measure an experiment's progress. Note that this default can be overridden at the experiment level.
Set formatting options
Finally, you can select how the metric should be formatted: as a number or as a percentage.