Data management
In this part of the documentation, we dive deep into the plumbing of Eppo: the data management layer. Here, you annotate your data warehouse, pointing Eppo to correct tables and telling us how to query your data. Once this setup is complete, we can now create metrics based on the event data, and then analyze any experiment using these metrics.
Data annotation
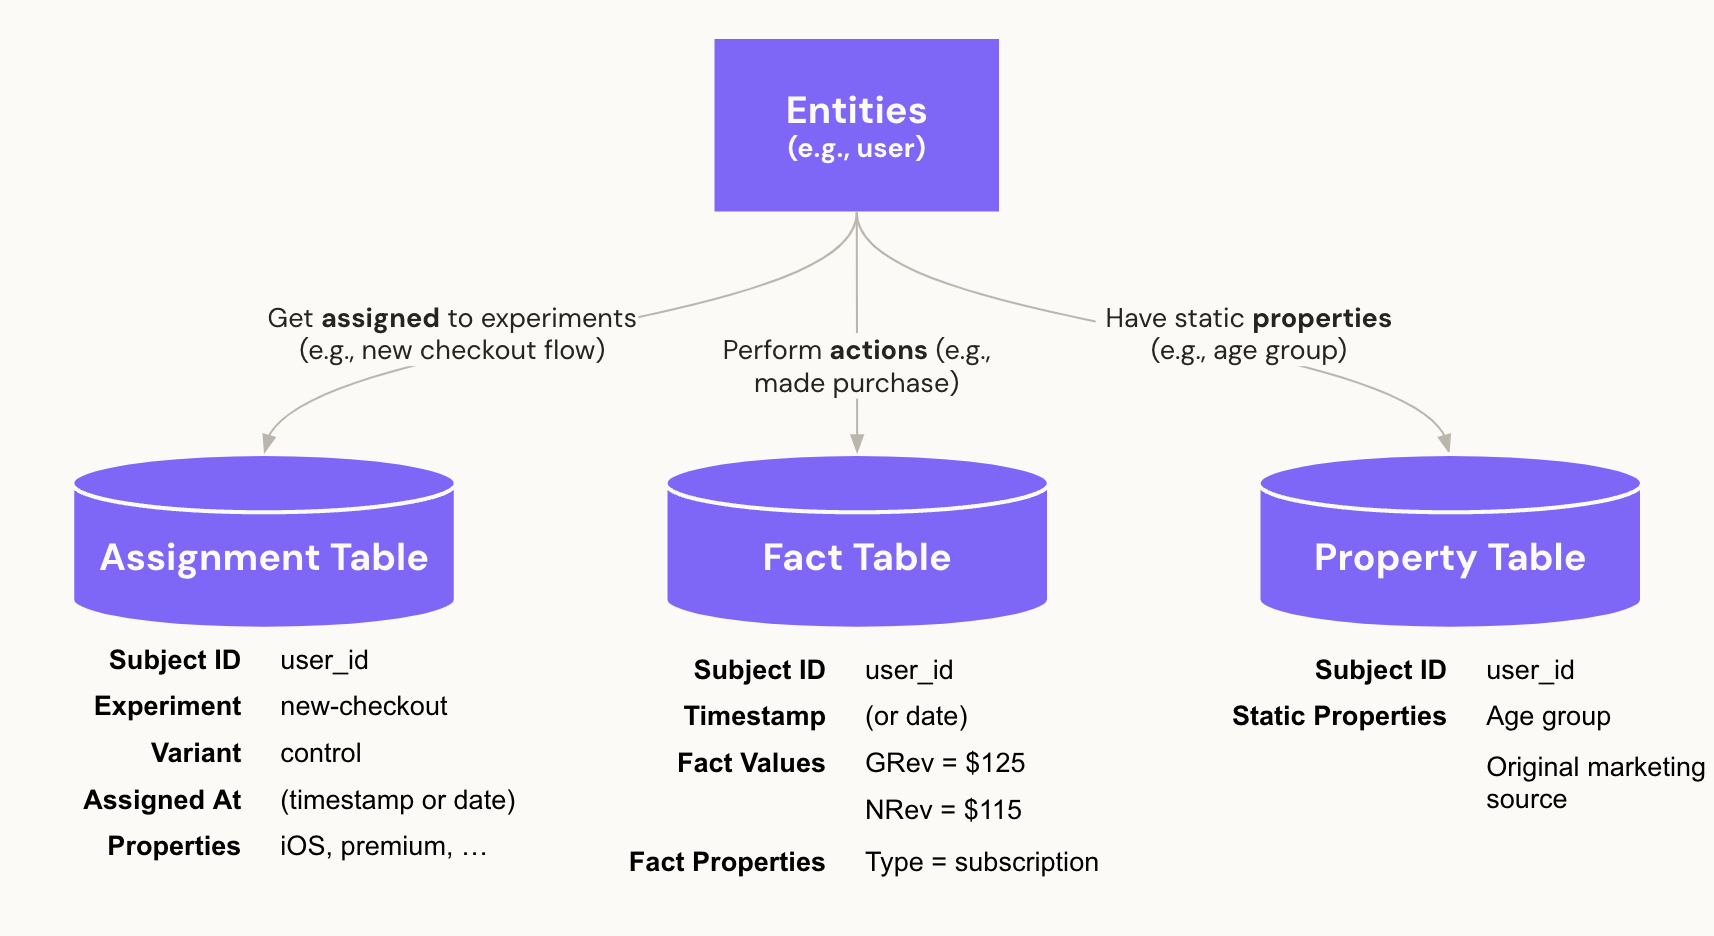
The following diagram illustrates how the core concepts of entities, assignments, facts, and properties relate.

Note that the assignment and properties tables have properties at the entity level, while the fact table has properties at the event (or metric) level.
Entities
Entities are the subjects (aka randomization unit) of your experiments. Most commonly, there is a single entity: the User (or Client, Customer, etc.) However, in some cases there are multiple entities. For example, if you are a food delivery app, and you want to run experiments on Restaurants, Customers, and Drivers, you would have a restaurant entity, a customer entity, and a driver entity.
Annotating tables
There are three core tables that Eppo needs to know about to successfully analyze experiments.
- Assignment tables: which subjects participated in experiments and what variants did they see?
- Fact tables: what actions did subjects take, so we can turn them into metrics?
- Property tables: what additional information do we have on entities that we want to slice experiment analyses by?
Metrics
Once the relevant tables in your data warehouse are annotated in Eppo, we want to create metrics.
As a simple example, we might have an event table with purchase events, and we want to create a User Revenue metric based on these events by summing the purchase prices for each user.
However, it is equally easy to configure more complex metrics, such as conversion metrics, ratio metrics, and funnels.
Metric collections
Finally, we can group similar metrics in a metric collection, which allows us to effortlessly add all of them to a particular experiment at once.